This is a guest post by Emily Chang, Technical Author at Datadog. A modified version of this article was originally posted on theDatadog blog. |
If you’re using Jenkins to continuously integrate changes into your projects, it’s helpful to be able to quickly identify build failures and assess their impact on other components of your stack.
Datadog’s plugin helps users monitor and alert on the performance of their Jenkins builds, right alongside the rest of their infrastructure and applications.
As shown in the out-of-the-box dashboard below, the Datadog plugin provides a bird’s-eye view of job history and trends. You can use Datadog to:
Set alerts for important build failures
Identify trends in build durations
Correlate Jenkins events with performance metrics from other parts of your infrastructure in order to identify and resolve issues
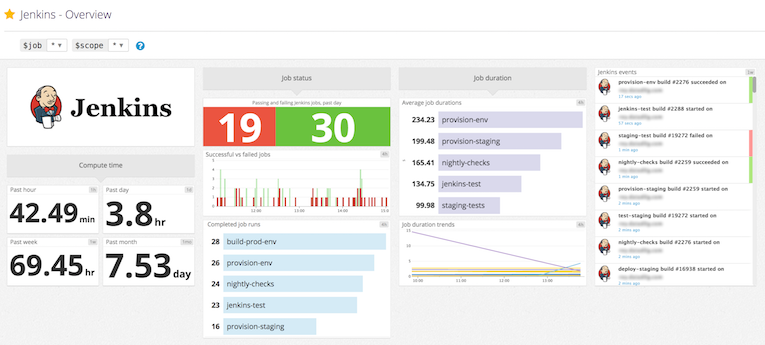
Track Jenkins build status in real-time
Once you install the Datadog plugin, Jenkins activities (when a build starts, fails, or succeeds) will start appearing in your Datadog event stream. You will also see what percentage of builds failed within the same job, so that you can quickly spot which jobs are experiencing a higher rate of failure than others.
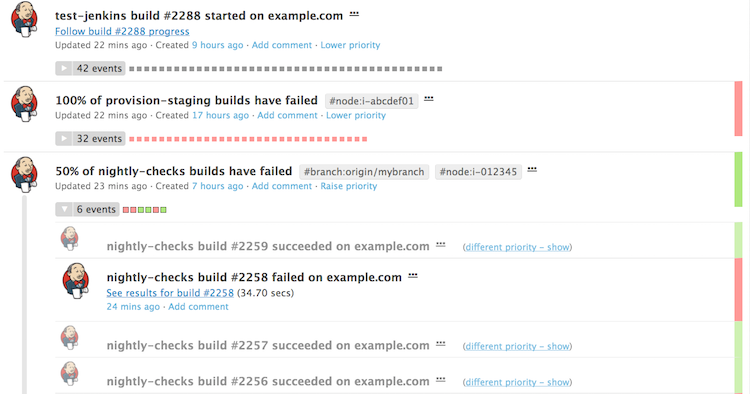
Remember to blacklist any jobs you don’t want to track by indicating them in your plugin configuration.
Datadog’s out-of-the-box Jenkins dashboard includes a status widget that displays the count of all jobs that have run in the past day, grouped by success or failure. To explore further, you can also click on the widget to view the individual jobs that have failed or succeeded in the past day.
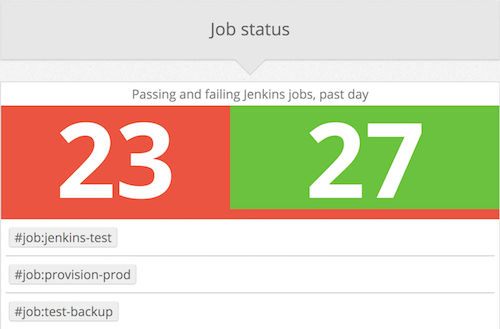
The dashboard also displays the proportion of successful vs. failed builds, along with the total number of job runs completed over the past four hours.
Datadog enables you to correlate Jenkins events with application performance metrics to investigate the root cause of an issue. For example, the screenshot below shows that average CPU on the app servers increased sharply after a Jenkins build was completed and deployed (indicated by the pink bar). Your team can use this information as a starting point to investigate if code changes in the corresponding release may be causing issues.

Visualize job duration metrics
Every time a build is completed, the plugin collects the build duration as a metric that you can aggregate by job name or any other tag, and graph over time. In the screenshot below, we can view the average job durations in the past four hours, sorted in decreasing order:
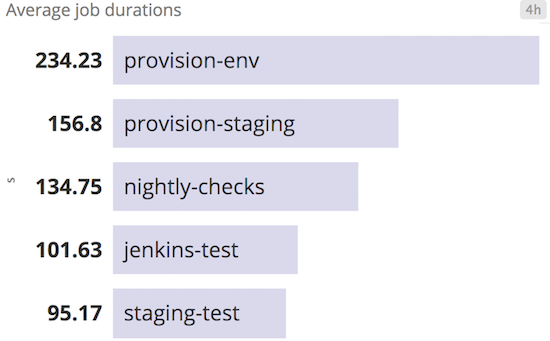
You can also graph and visualize trends in build durations for each job by using Datadog’s robust_trend() linear regression function, as shown in the screenshot below. This graph indicates which jobs' durations are trending longer over time, so that you can investigate if there appears to be a problem. If you’re experimenting with changes to your CI pipeline, consulting this graph can help you track the effects of those changes over time.

Use tags to monitor your Jenkins jobs
Tags add custom dimensions to your monitoring, so you can focus on what’s important to you right now.
Every Jenkins event, metric, and service check is auto-tagged with job, result, and branch (if applicable). You can also enable the optional node tag in the plugin settings.
As of version 0.5.0, the plugin supports custom tags. This update was developed by one of our open source contributors, Mads Nielsen. Many thanks to Mads for helping us implement this feature!
You can create custom tags for the name of the application you’re building, your particular team name (e.g. team=licorice), or any other info that matters to you. For example, if you have multiple jobs that perform nightly builds, you might want to create a descriptive tag that distinguishes them from other types of jobs.

As shown in the configuration settings above, you can add custom tags, formatted as key=value, in two ways:
in a text file (saved in the workspace for the job)
in a list of properties in the text box
Set up the Datadog plugin
The Datadog plugin requires Jenkins 1.580.1 or newer.
In Jenkins, navigate to Manage Jenkins > Manage Plugins.
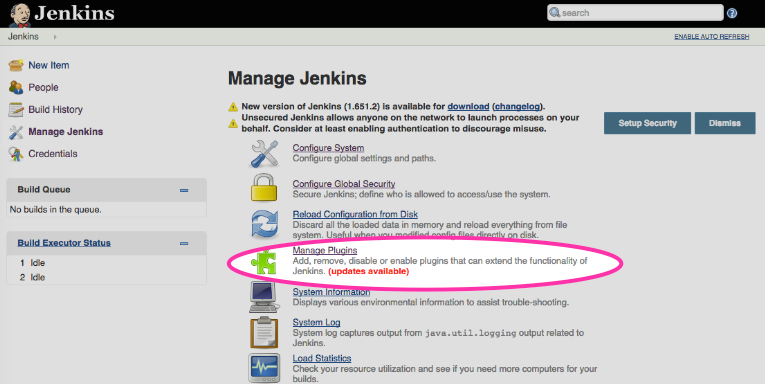
Search for Datadog Plugin and check the box to install it.

In Jenkins, go to Manage Jenkins > Configure System.
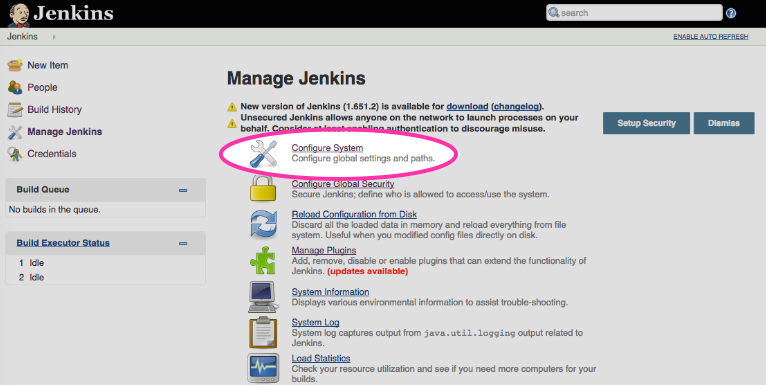
Scroll down to the Datadog Plugin section, and paste your API key in the text box. You can copy this from the API Keys page of your Datadog account. Click Test Key to confirm that the plugin recognizes your API key.
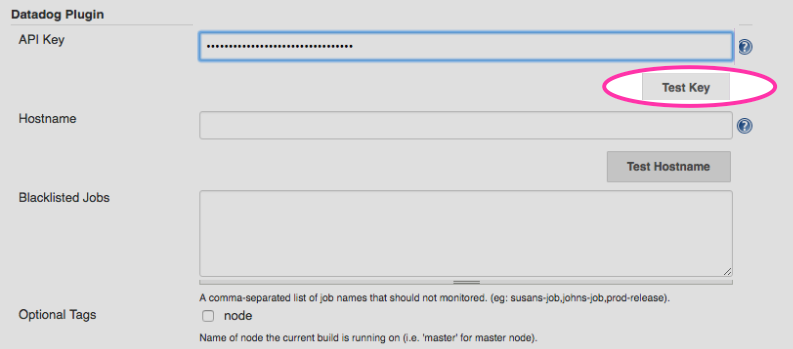
Save your changes, and you’re all set!
Get started
If you’re already using Datadog, you can start monitoring Jenkins jobs by following the instructions here to download the Datadog plugin. If you’re not using Datadog yet, here’s a 14-day free trial.