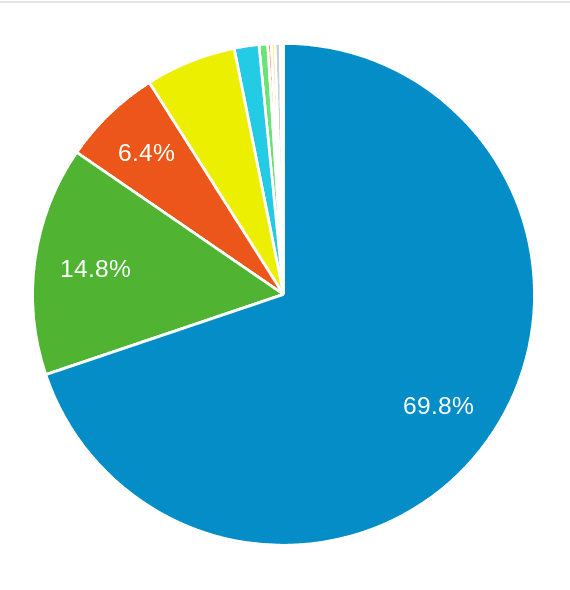
Over the last year, several efforts were done on jenkins.io likesecurity advisories or documentation and I wanted to understand the impact it had on its traffic.
I had a look to the Google Analytics account used for jenkins.io and it was interesting to discover which browsers are used by Jenkins visitors and how this compares with other websites. So I decided to analyze one year of data from January 2017 to January 2018. Then I selectedstatcounter as an external data source in order to compare results from jenkins.io.
First, let’s talk about numbers:
During that period, 3,496,245 users across the world visited this website.
This is a growth of 52.69% visitors compared to the year before.
92.28% of them used a desktop, 6.63% were on mobile and only 1.10% on a tablet.

| Browser | Percentage |
|---|---|
Chrome | 69.82% |
Firefox | 14.75% |
Safari | 6.44% |
IE | 5.84% |
Edge | 1.59% |
We clearly see that 91% of Jenkins.io visitors only use three browsers. Chrome is by far the leader followed by Firefox and Safari.
Obviously those numbers taken alone don’t mean anything, so let’s try to put them in perspective with another data source.
Netscape 4.8 was still used by 15 visitors over the year.
6 visitors used their Nintendo DS.
StatCounter
Let’s now compare our previous results with the same time period from statcounter who argues to collect data from 2million websites. Statcounter allow us to display browsers stats based on 4 different categories, All platform, Desktop, Tablet or Mobile. + For this comparison, I am interested by All platform and of course Desktop as 92.28% of Jenkins.io visitors use a desktop.
| Browser | Percentage |
|---|---|
Chrome | 54.13% |
Safari | 14.50% |
UC Browser | 8.25% |
Firefox | 6.15% |
IE | 3.89% |
Excepted Chrome who still leads the ranking with "only" 54%, all the others actors are totally shuffled. Safari moved to the 2nd place with 14.50% UC Browser appeared in the top 3 with 8.25% where only 0.10% of Jenkins.io visitors were using UC browser. Firefox moved to the 4th places with only 6.15%. It’s interesting how this "All platform" browser market share from statcounter doesn’t reflect Jenkins.io visitors' habits. (Source)
Now at a first glance, results look more similar to the Jenkins.io visitors; excepted for Chrome and Firefox which shed some percentages in favor of Internet Explorer and Edge. This promotes IE to the 3rd place with 8.86% of usage, and downgrade Safari to the 4th place with 6,44%. Compared to Jenkins.io results, Edge is still at the 5th position. It’s very interesting to see how this ranking is so different from the "All platform" one but follows the same pattern coming from Jenkins.io visitors. This highlights how browser choices are strongly influenced by the platform used and contrary to a general trend, Jenkins.io visitors remain desktop users. This absence of mobile users probably explains why some browsers are so under represented within Jenkins visitors. (Source)
| Browser | Usage |
|---|---|
Chrome | 63.59% |
Firefox | 13.75% |
IE | 8.86% |
Safari | 5.50% |
Edge | 4.35% |
Conclusion
These observations should be carefully interpreted as it may be overestimated or underestimated (depending on various factors) and doesn’t take into consideration local specificities.
Jenkins.io visitors are a majority of desktop users. They are aligned with the world trends when we talk about desktop browsers however only a minority of them come from a mobile. This is probably because jenkins.io is not (yet) mobile friendly and obsiously this would be a nice improvement to have.
All contributions are welcomed and especially for mobile user experience.