Quantcast
Channel: Jenkins Blog
Viewing all 1088 articles
Browse latest View live

New, safer CLI in 2.54

$
0
0

In response to the zero-day vulnerability we fixed in November, I wrote the following:

Moving forward, the Jenkins security team is revisiting the design of the Jenkins CLI over the coming weeks to prevent this class of vulnerability in the future. If you are interested in participating in that discussion, please join in on the jenkinsci-dev@ mailing list.

In early February, several project contributors met after FOSDEM for a one day hackathon. I looked into the feasibility of a purely SSH-based CLI. While I considered the experiment to be a success, it was far from ready to be used in a production environment.

A few weeks later, long-time contributor and Jenkins security team member Jesse Glicktook over, and published a detailed proposal for a new, simple CLI protocol without remoting.

In just a month, he implemented his proposal, and I’m very happy to announce that this new implementation of the Jenkins CLI has now made it into 2.54!

Existing jenkins-cli.jar clients should continue working as before, unless an administrator disables the remoting connection mode in Configure Global Security. That said, we recommend you download the new jenkins-cli.jar in Jenkins, and use its the new -http mode. With few (now deprecated) exceptions, CLI commands work like before. This will allow you to disable the remoting mode for the CLI on the Jenkins master to prevent similar vulnerabilities in the future.

SSH-based CLI use should be unaffected by this change. Note that new Jenkins instances now start with the SSH server port disabled, and the configuration option for that was moved into Configure Global Security.

You can learn all about the CLI and its new behavior in the Jenkins handbook.


Getting Started with Blue Ocean's Activity View

$
0
0
This is a guest post by Liam Newman, Technical Evangelist at CloudBees.

Blue Ocean is a new user experience for Jenkins, and version 1.0 is now live! Blue Ocean makes Jenkins, and continuous delivery, approachable to all team members. In my previous post, I showed how easy it is to create and edit Declarative Pipelines using the Blue Ocean Visual Pipeline Editor. In this video, I’ll use the Blue Ocean Activity View to track the state of branches and Pull Requests in one project. Blue Ocean makes it so much easier to find the logs I need to triage failures.

Please Enjoy! In my next video, I’ll switch from looking at a single project to monitoring multiple projects with the Blue Ocean Dashboard.

Jenkins World 2017 Agenda is Live!

$
0
0

This is a guest post by Alyssa Tong, who runs the Jenkins Area Meetup program and is also responsible for Marketing & Community Programs at CloudBees, Inc.

I am excited to announce the agenda forJenkins World 2017. This year’s event promises to have something for everyone - whether you are a novice, intermediate, or advanced user…​you are covered. Jenkins World 2017 consists of 6 tracks, 60+ Jenkins and DevOps sessions, 40+ industry speakers, 16+ training and workshops.

jenkinsworld shutterfly speaking

Here is a sneak peek at Jenkins World 2017:

Show 'n Tell

It’s all about that demo. These sessions are technically advanced with some code sharing, heavy on demos and just a tad bit of slides.

  • Plugin Development for Pipeline

  • Extending Blue Ocean

  • How to Use Jenkins Less: How and Why You Can Minimize Your Jenkins Footprint

  • Jenkins Pipeline on your Local Box to Reduce Cycle Time

brian tweet

War Stories

These are first-hand Jenkins experience and lessons learned. These stories will inspire your innovative solutions.

  • Pipelines At Scale: How Big, How Fast, How Many?

  • JenkinsPipelineUnit: Test Your Continuous Delivery Pipeline

  • Codifying the Build and Release Process with a Jenkins Pipeline Shared Library

  • Jumping on the Continuous Delivery Bandwagon: From 100+ FreeStyle Jobs to Pipeline(s) - Tactics, Pitfalls and Woes

james tweet

Trainings and Workshops

(additional fees apply to certain trainings/workshops)

  • Introduction to Jenkins

  • Introduction to Plugin Development

  • Let’s Build a Jenkins Pipeline!

  • Fundamentals of Jenkins and Docker

The Jenkins World agenda is packed with even more sessions, it will be a very informational event.

saldin tweet

Convince your Boss

We know that attending Jenkins World needs little convincing but just in case you need a little help to justify your attendance, we’ve created a Justify your Trip document to help speed up the process.

Register for Jenkins World 2017 with the code JWATONG for a 20% discount off your pass.

Hope to see you there!

Getting Started with the Blue Ocean Dashboard

$
0
0
This is a guest post by Liam Newman, Technical Evangelist at CloudBees.

Blue Ocean is a new user experience for Jenkins, and version 1.0 is now live! Blue Ocean makes Jenkins, and continuous delivery, approachable to all team members. In my previous post, I used the Blue Ocean Activity View to track the state of branches and Pull Requests in one project. In this video, I’ll use the Blue Ocean Dashboard get a personalized view of the areas that of my project that are most important to me, and also to monitor multiple projects. Please Enjoy!

Delivery Pipelines, with Jenkins 2, SonarQube, and Artifactory

$
0
0

This is a guest post by Michael Hüttermann. Michael is an expert in Continuous Delivery, DevOps and SCM/ALM. More information about him at huettermann.net, or follow him on Twitter: @huettermann.

Continuous Delivery and DevOps are well known and widely spread practices nowadays. It is commonly accepted that it is crucial to form great teams and define shared goals first and then choose and integrate the tools fitting best to given tasks. Often it is a mashup of lightweight tools, which are integrated to build up Continuous Delivery pipelines and underpin DevOps initiatives. In this blog post, we zoom in to an important part of the overall pipeline, that is the discipline often called Continuous Inspection, which comprises inspecting code and injecting a quality gate on that, and show how artifacts can be uploaded after the quality gate was met. DevOps enabler tools covered are Jenkins, SonarQube, and Artifactory.

The Use Case

You already know that quality cannot be injected after the fact, rather it should be part of the process and product from the very beginning. As a commonly used good practice, it is strongly recommended to inspect the code and make findings visible, as soon as possible. For that SonarQube is a great choice. But SonarQube is not just running on any isolated island, it is integrated in a Delivery Pipeline. As part of the pipeline, the code is inspected, and only if the code is fine according to defined requirements, in other words: it meets the quality gates, the built artifacts are uploaded to the binary repository manager.

Let’s consider the following scenario. One of the busy developers has to fix code, and checks in changes to the central version control system. The day was long and the night short, and against all team commitments the developer did not check the quality of the code in the local sandbox. Luckily, there is the build engine Jenkins which serves as a single point of truth, implementing the Delivery Pipeline with its native pipeline features, and as a handy coincidence SonarQube has support for Jenkins pipeline.

The change triggers a new run of the pipeline. Oh no! The build pipeline broke, and the change is not further processed. In the following image you see that a defined quality gate was missed. The visualizing is done with Jenkins Blue Ocean.

01 PipelineFailedBlueOcean

SonarQube inspection

What is the underlying issue? We can open the SonarQube web application and drill down to the finding. In the Java code, obviously a string literal is not placed on the right side.

02 Finding

During a team meeting it was decided to define this to be a Blocker, and SonarQube was configured accordingly. Furthermore, a SonarQube quality gate was created to break any build, if a blocker was identified. Let’s now quickly look into the code. Yes, SonarQube is right, there is the issue with the following code snippet.

03 FindingVisualizedInCode

We do not want to discuss in detail all used tools, and also covering the complete Jenkins build job would be out of scope. But the interesting extract here in regard of the inspection is the following stage defined in Jenkins pipeline DSL:

config.xml: SonarQube inspection
    stage('SonarQube analysis') { (1)
        withSonarQubeEnv('Sonar') { (2)
          sh 'mvn org.sonarsource.scanner.maven:sonar-maven-plugin:3.3.0.603:sonar ' + (3)
          '-f all/pom.xml ' +
          '-Dsonar.projectKey=com.huettermann:all:master ' +
          '-Dsonar.login=$SONAR_UN ' +
          '-Dsonar.password=$SONAR_PW ' +
          '-Dsonar.language=java ' +
          '-Dsonar.sources=. ' +
          '-Dsonar.tests=. ' +
          '-Dsonar.test.inclusions=**/*Test*/** ' +
          '-Dsonar.exclusions=**/*Test*/**'
        }
    }
1The dedicated stage for running the SonarQube analysis.
2Allow to select the SonarQube server you want to interact with.
3Running and configuring the scanner, many options available, check the docs.

Many options are available to integrate and configure SonarQube. Please consult the documentation for alternatives. Same applies to the other covered tools.

SonarQube Quality Gate

As part of a Jenkins pipeline stage, SonarQube is configured to run and inspect the code. But this is just the first part, because we now also want to add the quality gate in order to break the build. The next stage is covering exactly that, see next snippet. The pipeline is paused until the quality gate is computed, specifically the waitForQualityGate step will pause the pipeline until SonarQube analysis is completed and returns the quality gate status. In case a quality gate was missed, the build breaks.

config.xml: SonarQube Quality Gate
    stage("SonarQube Quality Gate") { (1)
        timeout(time: 1, unit: 'HOURS') { (2)
           def qg = waitForQualityGate() (3)
           if (qg.status != 'OK') {
             error "Pipeline aborted due to quality gate failure: ${qg.status}"
           }
        }
    }
1The defined quality gate stage.
2A timeout to define when to proceed without waiting for any results for ever.
3Here we wait for the OK. Underlying implementation is done with SonarQube’s webhooks feature.

This blog post is an appetizer, and scripts are excerpts. For more information, please consult the respective documentation, or a good book, or the great community, or ask your local expert.

Since they all work in a wonderful Agile team, the next available colleague just promptly fixes the issue. After checking in the fixed code, the build pipeline runs again.

04 PipelineFixedBlueOcean

The pipeline was processed successfully, including the SonarQube quality gate, and as the final step, the packaged and tested artifact was deployed to Artifactory. There are a couple of different flexible ways how to upload the artifacts, the one we use here is using an upload spec to actually collect and upload the artifact which was built at the very beginning of the pipeline. Also meta information are published to Artifactory, since it is the context which matters and thus we can add valuable labels to the artifact for further processing.

config.xml: Upload to Artifactory
stage ('Distribute binaries') { (1)
    def SERVER_ID = '4711' (2)
    def server = Artifactory.server SERVER_ID
    def uploadSpec = (3)
    """
    {
    "files": [
        {
            "pattern": "all/target/all-(*).war",
            "target": "libs-snapshots-local/com/huettermann/web/{1}/"
        }
      ]
    }
    """
    def buildInfo = Artifactory.newBuildInfo() (4)
    buildInfo.env.capture = true (5)
    buildInfo=server.upload(uploadSpec) (6)
    server.publishBuildInfo(buildInfo) (7)
}
1The stage responsible for uploading the binary.
2The server can be defined Jenkins wide, or as part of the build step, as done here.
3In the upload spec, in JSON format, we define what to deploy to which target, in a fine-grained way.
4The build info contains meta information attached to the artifact.
5We want to capture environmental data.
6Upload of artifact, according to upload spec.
7Build info are published as well.

Now let’s see check that the binary was deployed to Artifactory, successfully. As part of the context information, also a reference to the producing Jenkins build job is available for better traceability.

05 BinaryDeployedInArtifactory

Summary

In this blog post, we’ve discovered tips and tricks to integrate Jenkins with SonarQube, how to define Jenkins stages with the Jenkins pipeline DSL, how those stages are visualized with Jenkins Blue Ocean, and how the artifact was deployed to our binary repository manager Artifactory. Now I wish you a lot of further fun with your great tools of choice to implement your Continuous Delivery pipelines.

Securing a Jenkins instance on Azure

$
0
0
This is a guest post by Claudiu Guiman and Eric Jizba, Software Engineers in the Azure DevOps team at Microsoft. If you have any questions, please email us at azdevopspub@microsoft.com.

One of the most frequently asked questions for managing a Jenkins instance is "How do I make it secure?" Like any other web application, these issues must be solved:

  • How do I securely pass secrets between the browser and the server?

  • How do I hide certain parts from unauthorized users and show other parts to anonymous users?

This blog post details how to securely connect to a Jenkins instance and how to setup a read-only public dashboard. We’ll cover topics like: setting up a reverse proxy, blocking inbound requests to certain URLs and ports, enabling project-based authorization, and making the Jenkins agents accessible through the JNLP protocol.

Deploy Jenkins

The simplest way to deploy a secure Jenkins instance is to use one of these Azure QuickStart templates:

If you have an existing Jenkins instance or want to setup your instance manually, follow the steps below.

Securely log in to Jenkins

After you’ve deployed your new virtual machine with a hosted Jenkins instance, you will notice that by default the instance listens on port 8080 using HTTP. If you want to set up HTTPS communication, you will need to provide an SSL certificate. Unfortunately, most certificate authorities are not cheap and other free services like Let’s Encrypt have a very small quota (about 20 certificates per week for the entire azure.com subdomain). The only other option is to use a self-signed certificate, but then users must explicitly verify and mark your certificate as trusted, which is not recommended.

If you do not setup HTTPS communication, the best way to make sure the sign-in credentials are not leaked due to a Man-in-the-middle attack is to only log in using SSH tunneling. An SSH tunnel is an encrypted tunnel created through an SSH protocol connection, which can be used to transfer unencrypted traffic over an unsecured network. Simply run this command:

Linux or Mac
    ssh -L 8080:localhost:8080 <username>@<domain name>
Windows ( using PuTTY)
    putty.exe -ssh -L 8080:localhost:8080 <username>@<domain name>

This command will open an SSH connection to your remote host and bind remote port 8080 to listen to requests coming from your local machine. Navigate to http://localhost:8080 on your local machine to view your Jenkins dashboard and you’ll be able to log in securely.

Setup a reverse proxy

Now that you can securely log in to your Jenkins instance, you should prevent people from accidentally authenticating through the public (unsecured) interface. To achieve this, you can setup a reverse proxy on the Jenkins hosting machine that will listen on a different port (80 is the best candidate) and redirect only certain requests to port 8080.

Specifically, it is recommended to block the login and the CLI requests. Some CLI versions fall back to unsecure HTTP connections if they have problems establishing the secured connection. In most cases, users don’t need the CLI and it should be enabled on an as-needed basis.

  1. Install Nginx:

    sudo apt-get update
    sudo apt-get install nginx
  2. Open the Nginx config file:

    sudo nano /etc/nginx/sites-enabled/default
  3. Modify the file to configure Nginx to work as a reverse proxy (you’ll need to update <your domain name>):

    server {
        listen 80;
        server_name <your domain name>;
        # Uncomment the line bellow to change the default 403 error page
        # error_page 403 /secure-jenkins;
        location / {
            proxy_set_header        Host \$host:\$server_port;
            proxy_set_header        X-Real-IP \$remote_addr;
            proxy_set_header        X-Forwarded-For \$proxy_add_x_forwarded_for;
            proxy_set_header        X-Forwarded-Proto \$scheme;
            proxy_pass              http://localhost:8080;
            proxy_redirect          http://localhost:8080 http://<your domain name>;
            proxy_read_timeout      90;
        }
        #block requests to /cli
        location /cli {
            deny all;
        }
        #block requests to /login
        location ~ /login* {
            deny all;
        }
        # Uncomment the lines bellow to redirect /secure-jenkins
        #location /secure-jenkins {
        #  alias /usr/share/nginx/secure-jenkins;
        #}
    }

    The first section tells the Nginx server to listen to any requests that come from port 80. It also contains a commented redirect of the 403 error to a custom location (we’ll get back to this later).

        listen 80;
        server_name <your domain name>;
        # error_page 403 /secure-jenkins;

    The next section describes the reverse proxy configuration. This tells the Nginx server to take all incoming requests and proxy them to the Jenkins instance that is listening to port 8080 on the local network interface.

        location / {
            proxy_set_header        Host \$host:\$server_port;
            proxy_set_header        X-Real-IP \$remote_addr;
            proxy_set_header        X-Forwarded-For \$proxy_add_x_forwarded_for;
            proxy_set_header        X-Forwarded-Proto \$scheme;
            proxy_pass              http://localhost:8080;
            proxy_redirect          http://localhost:8080 http://<your domain name>;
            proxy_read_timeout      90;
        }

    The last section filters out specific URLs (login, cli) and denies access to them.

        location /cli {
            deny all;
        }
        location ~ /login* {
            deny all;
        }
  4. Restart Nginx:

    sudo service nginx restart
  5. Go to http://<your domain name> and verify you can access your Jenkins instance.

  6. Verify clicking login returns a 403 Forbidden page. If you want to customize that page, update the Nginx configuration and remove the comments around /secure-jenkins. This will redirect all 403 errors to the file /usr/share/nginx/secure-jenkins. You can add any content to that file, for example:

    sudo mkdir /usr/share/nginx/secure-jenkins
    echo "Access denied! Use SSH tunneling to log in to your Jenkins instance!" | sudo tee /usr/share/nginx/secure-jenkins/index.html
If restart fails or you cannot access your instance, check the error log: cat /var/log/nginx/error.log

Secure your Jenkins dashboard

If you go to http://<your domain name>:8080 you’ll notice you can still bypass the reverse proxy and access the Jenkins instance directly through an unsecure channel. You can easily block all inbound requests on port 8080 on Azure with a Network Security Group (NSG).

  1. Create the NSG and add it to your existing network interface or to the subnet your Azure Virtual Machine is bound to.

  2. Add 2 inbound security rules:

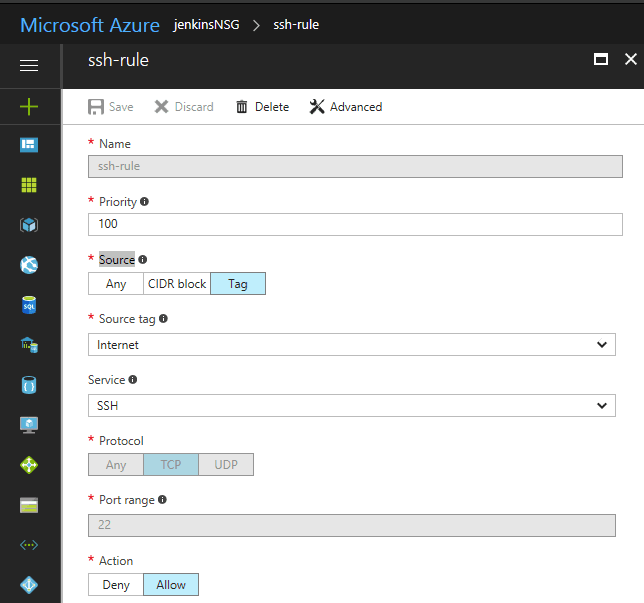
    • Allow requests to port 22 so you can SSH into the machine.

      nsg ssh
    • Allow requests to port 80 so the reverse proxy can be reached

      nsg http
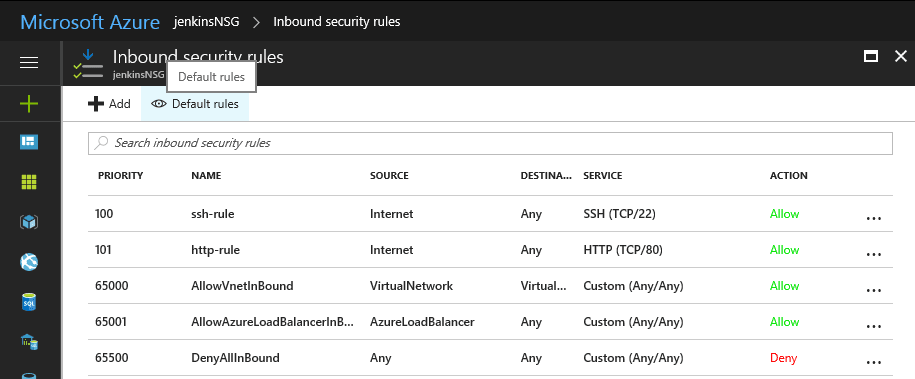
      By default, all other external traffic will be blocked
      nsg inbound
  3. Navigate to http://<your domain name>:8080 and verify you cannot connect.

    If you don’t want to deploy an Azure Network Security Group, you can block port 8080 using the Uncomplicated Firewall (ufw)

Configure read-only access to your dashboard

After installing Jenkins, the default security strategy is Logged-in users can do anything. If you want to allow read-only access to anonymous users, you need to set up Matrix-based security. In this example, we’ll set up a project-based authorization matrix, so that you can make certain projects private and others public.

  1. Install the Matrix Authorization Strategy Plugin and restart Jenkins.

  2. Go to http://localhost:8080/configureSecurity/ (Configure Global Security page under Manage Jenkins) and select Project-base Matrix Authorization Strategy from the Authorization options.

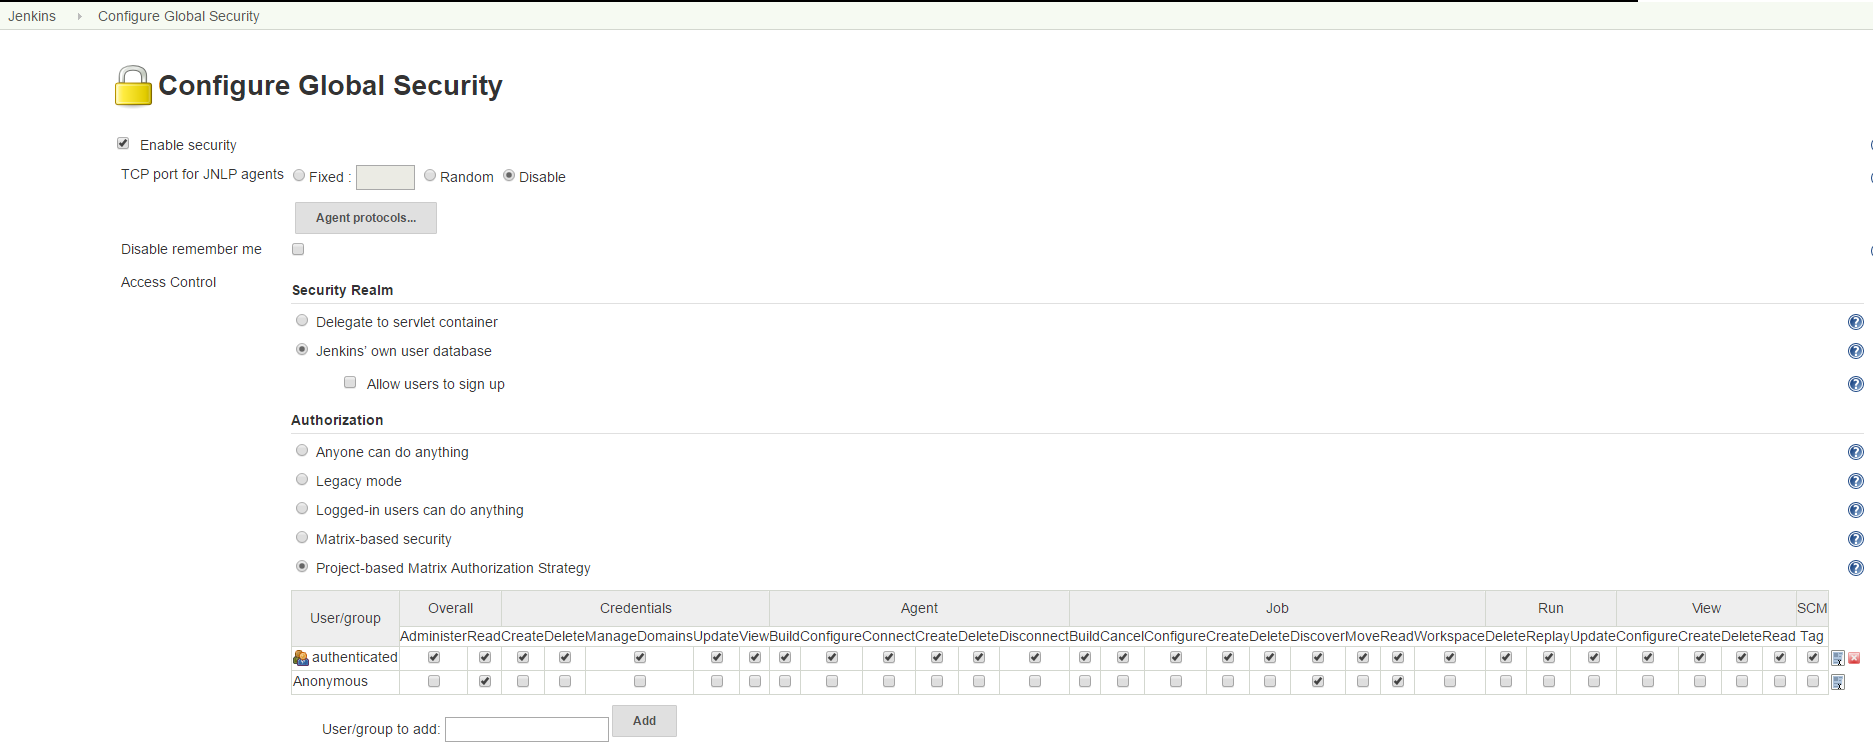
  3. As an example, you can grant read-only access to anonymous users (Overall/Read, Job/Discover and Job/Read should be enough) and grant all logged in users full access in a group called authenticated:

auth matrix

Connect JNLP-based agents

Since your Jenkins instance is only accessible through the reverse proxy on port 80, any Jenkins agents that use the JNLP protocol will not be able to register to the master anymore. To overcome this problem, all agents must be in the same virtual network as the Jenkins master and must connect using their private IP (by default, the NSG allows all internal traffic).

  1. Make sure that the Jenkins virtual machine will always be assigned the same private IP by going to the Azure Portal, opening the Network Interface of your virtual machine, opening IP configuration, and clicking on the configuration.

  2. Make sure the Private IP has a static assignment and restart the virtual machine if necessary.

    private ip
  3. Copy the static IP Address and go to http://localhost:8080/configure (Configure System page under Manage Jenkins) and update the Jenkins URL to point to that private IP (http://10.0.0.5:8080/ in this example)

Now agents can communicate through JNLP. If you want to streamline the process, you can use theAzure VM Agents plugin, which automatically deploys agents in the same virtual network and connects them to the master.

Important security updates for Jenkins core

$
0
0

We just released security updates to Jenkins, versions 2.57 and 2.46.2, that fix several security vulnerabilities, including a critical one.

That critical vulnerability is an unauthenticated remote code execution via the remoting-based CLI.When I announced the fix for the previous vulnerability of this kind, I announced our plans to revisit the design of the CLI that enabled this class of vulnerabilities.

Since Jenkins 2.54, we now have a new CLI implementation that isn’t based on remoting, and deprecated its remoting mode. Despite it being a major feature, we decided to backport it to 2.46.2, so LTS users can also disable the unsafe remoting mode while retaining almost all of the CLI’s existing functionality.

For an overview of what was fixed, see the security advisory. For an overview on the possible impact of these changes on upgrading Jenkins LTS, see our LTS upgrade guide. I recommend you read these documents, especially if you’re using the CLI with Jenkins LTS, as there are possible side effects of these fixes.

Subscribe to the jenkinsci-advisories mailing list to receive important notifications related to Jenkins security.

Calling for Colombian Jenkins users!

$
0
0

The Jenkins project has learned that a company is trying to register "Jenkins" as a trademark in Colombia. This is alarming for us, and we are trying to oppose it. In order to do this effectively, we need to hear from Colombian users of Jenkins.

South American traffic to jenkins.io for 2017
Figure 1. South American visitors to jenkins.io for 2017

The Jenkins project owns a trademark "Jenkins" in the U.S., through a non-profit entity SPI Inc. According to experts on the subject citing the "Washington Convention", our trademark registration in the U.S. does give us some strength in the argument to oppose this. To successfully mount this argument however, we need to be able to show that Jenkins has significant usage and awareness in Colombia. Users, installations, meetups, conference talks, anything of that nature will help.

Those of you with the project for a long time might recall that the name "Jenkins" was born because of a trademark issue with Oracle. So we are particularly sensitive to the issue is trademarks. We want to make sure the same tragedy won’t happen again.

If you know anything about the usage and the name recognition of Jenkins in Colombia, please let us know by submitting the information here. We know that Jenkins is popular in Colombia, because our website traffic shows that Colombian Jenkins users are the third most frequent visitors to jenkins.io in South America after Brazil and Argentina.

This information will be only shared with the Jenkins project board and those involved in the defense, and for the sole purpose of defending the trademark and nothing more.

Please help us spread the word. Thanks!


El proyecto Jenkins se ha enterado de que una compañía está intentando registrar "Jenkins" como marca registrada en Colombia. Esto es alarmante y estamos tratando de oponernos. Para hacerlo de manera efectiva, necesitamos escuchar a los usuarios colombianos de Jenkins.

El proyecto Jenkins posee una marca registrada "Jenkins" en los Estados Unidos, a través de una entidad sin ánimo de lucro SPI Inc. Según los expertos en la materia citando la "Convención de Washington", nuestro registro de marca en los EE.UU. nos da algo de fuerza para oponernos. Sin embargo, para argumentar con éxito, tenemos que ser capaces de demostrar que Jenkins tiene un uso significativo y es conocido en Colombia. Usuarios, instalaciones, encuentros, conferencias, cualquier cosa de ese tipo ayudará.

Aquellos que llevan mucho tiempo con el proyecto pueden recordar que el nombre "Jenkins" nació debido a un problema de marca con Oracle. Por lo tanto, estamos especialmente sensibles al tema de las marcas registradas. Queremos asegurarnos de que el mismo problema no vuelva a ocurrir.

Si sabe algo sobre el uso y el reconocimiento del nombre Jenkins en Colombia, por favor háganoslo saber enviando la información aquí. Sabemos que Jenkins es popular en Colombia, porque nuestro sitio web de tráfico muestra que los usuarios colombianos de Jenkins son los terceros visitantes más frecuentes a jenkins.io en América del Sur después de Brasil y Argentina.

Esta información sólo se compartirá con el comité de proyecto de Jenkins y los involucrados en la defensa, y con el único propósito de defender la marca y nada más.

Por favor, ayúdenos a difundir la palabra. ¡Gracias!


Jenkins World 2017 Community Awards - Open for Nominations!

$
0
0

This is a guest post by Alyssa Tong, who runs the Jenkins Area Meetup program and is also responsible for Marketing & Community Programs at CloudBees, Inc.

trophies

This year at Jenkins World 2017, the Jenkins community will celebrate the Most Valuable Contributor, a Jenkins Security MVP, and the Most Valuable Advocate.

This will be the first year we are commemorating community members who have shown excellence through commitment, creative thinking, and contributions to continue making Jenkins a great open source automation server. Special thanks to CloudBees for the generous donations to make this program possible.

With that said, the Jenkins Community Award nomination is currently open. Nominate your story, or that of a fellow contributor, for recognition at Jenkins World. Ee sure to join us atJenkins World 2017 in San Francisco on August 28-31 to hear the winners announced.

Nominations will be accepted until June 16, 2017.Nominate someone today!

A journey to Kubernetes on Azure

$
0
0

With theongoing migration to Azure, I would like to share my thoughts regarding one of the biggest challenges we have faced thus far: orchestrating container infrastructure. Many of the Jenkins project’s applications are run as Docker containers, making Kubernetes a logical choice as far as running our containers, but it presents its own set of challenges. For example, what would the workflow from development to production look like?

Before going deeper into the challenges, let’s review the requirements we started with:

Git

We found it mandatory to keep track of all the infrastructure changes in Git repositories, including secrets, in order to facilitate reviewing, validation, rollback, etc of all infra changes.

Tests

Infrastructure contributors are geographically distributed and in different timezones. Getting feedback can take time, so we heavily rely on a lot of tests before any changes can be merged.

Automation

The change submitter is not necessarily the person who will deploy it. Repetitive tasks are error prone and a waste of time. For these reasons, all steps must be automated and stay as simple as possible.

A high level overview of our "infrastructure as code" workflow would look like:

Infrastructure as Code Workflow
  __________       _________       ______________
  |         |      |        |      |             |
  | Changes | ---->|  Test  |----->| Deployment  |
  |_________|      |________|  ^   |_____________|
                               |
                        ______________
                       |             |
                       | Validation  |
                       |_____________|

We identified two possible approaches for implementing our container orchestration with Kubernetes:

  1. The Jenkins Way: Jenkins is triggered by a Git commit, runs the tests, and after validation, Jenkins deploys changes into production.

  2. The Puppet Way: Jenkins is triggered by a Git commit, runs the tests, and after validation, it triggers Puppet to deploy into production.

Let’s discuss these two approaches in detail.

The Jenkins Way

Workflow
  _________________       ____________________       ______________
  |                |      |                   |      |             |
  |    Github:     |      |     Jenkins:      |      |   Jenkins:  |
  | Commit trigger | ---->| Test & Validation | ---->|  Deployment |
  |________________|      |___________________|      |_____________|

In this approach, Jenkins is used to test, validate, and deploy our Kubernetes configuration files. kubectl can be run on a directory and is idempotent. This means that we can run it as often as we want: the result will not change. Theoretically, this is the simplest way. The only thing needed is to runkubectl command each time Jenkins detects changes.

The following Jenkinsfile gives an example of this workflow.

Jenkinsfile
  pipeline {
    agent any
    stages {
      stage('Init'){
        steps {
          sh 'curl -LO https://storage.googleapis.com/kubernetes-release/release/$(curl -s https://storage.googleapis.com/kubernetes-release/release/stable.txt)/bin/linux/amd64/kubectl'
        }
      }
      stage('Test'){
        steps {
          sh 'Run tests'
        }
      }
      stage('Deploy'){
        steps {
          sh './kubectl apply -R true -f my_project'
        }
      }
    }
  }

The devil is in the details of course, and it was not as easy as it looked at first sight.

Order matters

Some resources needed to be deployed before others. A workaround was to use numbers as file names. But this added extra logic at file name level, for example:

project/00-nginx-ingress
project/09-www.jenkins.io

Portability

The deployment environments needed to be the same across development machines and the Jenkins host. Although this a well-known problem, it was not easy to solve. The more the project grew, the more our scripts needed additional tools (make, bats, jqgpg, etc). The more tools we used, the more issues appeared because of the different versions used.

Another challenge that emerged when dealing with different environments was: how should we manage environment-specific configurations (dev, prod, etc)? Would it be better to define different configuration files per environment? Perhaps, but this means code duplication, or using file templates which would require more tools (sed, jinja2, erb), and more work.

There wasn’t a golden rule we discovered, and the answer is probably somewhere in between.

In any case, the good news is that a Jenkinsfile provides an easy way to execute tasks from a Docker image, and an image can contain all the necessary tools in our environment. We can even use different Docker images for each stage along the way.

In the following example, I use the my_env Docker image. It contains all the tools needed to test, validate, and deploy changes.

Jenkinsfile
pipeline{
  agent {
    docker{
      image 'my_env:1.0'
    }
  }
  options{
    buildDiscarder(logRotator(numToKeepStr: '10'))
    disableConcurrentBuilds()
    timeout(time: 1, unit: 'HOURS')
  }
  triggers{
    pollSCM('* * * * *')
  }
  stages{
    stage('Init'){
      steps{// Init everything required to deploy our infra
        sh 'make init'
      }
    }
    stage('Test'){
      steps{// Run tests to validate changes
       sh 'make test'
      }
    }
    stage('Deploy'){
      steps{// Deploy changes in production
       sh 'make deploy'
      }
    }
  }
  post{
    always {
      sh 'make notify'
    }
  }
}

Secret credentials

Managing secrets is a big subject and brings with it many different requirements which are very hard to fulfill. For obvious reasons, we couldn’t publish the credentials used within the infra project. On the other hand, we needed to keep track and share them, particularly for the Jenkins node that deploys our cluster. This means that we needed a way to encrypt or decrypt those credentials depending on permissions, environments, etc. We analyzed two different approaches to handle this:

  1. Storing secrets in a key management tool like Key Vault or Vault and use them like a Kubernetes "secret" type of resource.
    → Unfortunately, these tools are not yet integrated in Kubernetes. But we may come back to this option later. Kubernetes issue: 10439

  2. Publishing and encrypting using a public GPG key.
    This means that everybody can encrypt credentials for the infrastructure project but only the owner of the private key can decrypt credentials.
    This solution implies:

    • Scripting: as secrets need to be decrypted at deployment time.

    • Templates: as secret values will change depending on the environment.
      → Each Jenkins node should only have the private key to decrypt secrets associated to its environment.

Scripting

Finally, the system we had built was hard to work with. Our initialJenkinsfile which only ran one kubectl command slowly become a bunch of scripts to accomodate for:

  • Resources needing to be updated only in some situations.

  • Secrets needing to be encrypted/decrypted.

  • Tests needing to be run.

In the end, the amount of scripts required to deploy the Kubernetes resources started to become unwieldy and we began asking ourselves: "aren’t we re-inventing the wheel?"

The Puppet Way

The Jenkins project already uses Puppet, so we decided to look at using Puppet to orchestrate our container deployment with Kubernetes.

Workflow
  _________________       ____________________       _____________
  |                |      |                   |      |            |
  |    Github:     |      |     Jenkins:      |      | Puppet:    |
  | Commit trigger | ---->| Test & Validation | ---->| Deployment |
  |________________|      |___________________|      |____________|

In this workflow, Puppet is used to template and deploy all Kubernetes configurations files needed to orchestrate our cluster. Puppet is also used to automate basic kubectl operations such as apply orremove for various resources based on file changes.

Puppet workflow
______________________
|                     |
|  Puppet Code:       |
|    .                |
|    ├── apply.pp     |
|    ├── kubectl.pp   |
|    ├── params.pp    |
|    └── resources    |
|        ├── lego.pp  |
|        └── nginx.pp |
|_____________________|
          |                                        _________________________________
          |                                       |                                |
          |                                       |  Host: Prod orchestrator       |
          |                                       |    /home/k8s/                  |
          |                                       |    .                           |
          |                                       |    └── resources               |
          | Puppet generate workspace             |        ├── lego                |
          └-------------------------------------->|        │   ├── configmap.yaml  |
            Puppet apply workspaces' resources on |        │   ├── deployment.yaml |
          ----------------------------------------|        │   └── namespace.yaml  |
          |                                       |        └── nginx               |
          v                                       |            ├── deployment.yaml |
 ______________                                   |            ├── namespace.yaml  |
 |     Azure:  |                                  |            └── service.yaml    |
 | K8s Cluster |                                  |________________________________|
 |_____________|

The main benefit of this approach is letting Puppet manage the environment and run common tasks. In the following example, we define a Puppet class for Datadog.

Puppet class for resource Datadog
# Deploy datadog resources on kubernetes cluster
#   Class: profile::kubernetes::resources::datadog
#
#   This class deploy a datadog agent on each kubernetes node
#
#   Parameters:
#     $apiKey:
#       Contain datadog api key.
#       Used in secret template
class profile::kubernetes::resources::datadog (
    $apiKey = base64('encode', $::datadog_agent::api_key, 'strict')
  ){
  include ::stdlib
  include profile::kubernetes::params
  require profile::kubernetes::kubectl

  file { "${profile::kubernetes::params::resources}/datadog":
    ensure => 'directory',
    owner  => $profile::kubernetes::params::user,
  }

  profile::kubernetes::apply { 'datadog/secret.yaml':
    parameters => {
        'apiKey' => $apiKey
    },
  }
  profile::kubernetes::apply { 'datadog/daemonset.yaml':}
  profile::kubernetes::apply { 'datadog/deployment.yaml':}

  # As secrets change do not trigger pods update,
  # we must reload pods 'manually' in order to use updated secrets.
  # If we delete a pod defined by a daemonset,
  # this daemonset will recreate pods automatically.
  exec { 'Reload datadog pods':
    path        => ["${profile::kubernetes::params::bin}/"],
    command     => 'kubectl delete pods -l app=datadog',
    refreshonly => true,
    environment => ["KUBECONFIG=${profile::kubernetes::params::home}/.kube/config"] ,
    logoutput   => true,
    subscribe   => [
      Exec['apply datadog/secret.yaml'],
      Exec['apply datadog/daemonset.yaml'],
    ],
  }
}

Let’s compare the Puppet way with the challenges discovered with the Jenkins way.

Order Matters

With Puppet, it becomes easier to define priorities as Puppet provides relationship meta parameters and the function require (see also:Puppet relationships).

In our Datadog example, we can be sure that deployment will respect the following order:

datadog/secret.yaml -> datadog/daemonset.yaml -> datadog/deployment.yaml

Currently, our Puppet code only applies configuration when it detects file changes. It would be better to compare local files with the cluster configuration in order to trigger the required updates, but we haven’t found a good way to implement this yet.

Portability

As Puppet is used to configure working environments, it becomes easier to be sure that all tools are present and correctly configured. It’s also easier to replicate environments and run tests on them with tools like RSpec-puppet, Serverspec orVagrant.

In our Datadog example, we can also easily change the Datadog API key depending on the environment with Hiera.

Secret credentials

As we were already using Hiera GPG with Puppet, we decided to continue to use it, making managing secrets for containers very simple.

Scripting

Of course the Puppet DSL is used, and even if it seems harder at the beginning, Puppet simplifies a lot the management of Kubernetes configuration files.

Conclusion

It was much easier to bootstrap the project with a full CI workflow within Jenkins as long as the Kubernetes project itself stays basic. But as soon as the project grew, and we started deploying different applications with different configurations per environment, it became easier to delegate Kubernetes management to Puppet.

If you have any comments feel free to send a message toJenkins Infra mailing list.

Thanks

Thanks to Lindsay Vanheyste, Jean Marc Meessen, and Damien Duportal for their feedback.

Pipeline Development Tools

$
0
0
This is a guest post by Liam Newman, Technical Evangelist at CloudBees.

I’ve only been working with Pipeline for about a year. Pipeline in and of itself has been a huge improvement over old-style Jenkins projects. As a developer, it has been so great be able work with Jenkins Pipelines using the same tools I use for writing any other kind of code.

I’ve also found a number of tools that are super helpful specifically for developing pipelines. Some were easy to find like the built-in documentation and theSnippet Generator. Others were not as obvious or were only recently released. In this post, I’ll show how a few of those tools make working with Pipelines even better.

The Blue Ocean Pipeline Editor

The best way to start this list is with the most recent and coolest arrival in this space: the Blue Ocean Pipeline Editor. The editor only works with Declarative Pipelines, but it brings a sleek new user experience to writing Pipelines. My recent screencast, released as part of the Blue Ocean Launch, gives good sense of how useful the editor is:

Command-line Pipeline Linter

One of the neat features of the Blue Ocean Pipeline Editor is that it does basic validation on our Declarative Pipelines before they are even committed or Run. This feature is based on theDeclarative Pipeline Linter which can be accessed from the command-line even if you don’t have Blue Ocean installed.

When I was working on theDeclarative Pipeline: Publishing HTML Reports blog post, I was still learning the declarative syntax and I made a lot lot of mistakes. Getting quick feedback about the whether my Pipeline was in a sane state made writing that blog much easier. I wrote a simple shell script that would run my Jenkinsfile through the Declarative Pipeline Linter.

pipelint.sh - Linting via HTTP POST using curl
# curl (REST API)
# User
JENKINS_USER=bitwisenote-jenkins1

# Api key from "/me/configure" on my Jenkins instance
JENKINS_USER_KEY=--my secret, get your own--

# Url for my local Jenkins instance.
JENKINS_URL=http://$JENKINS_USER:$JENKINS_USER_KEY@localhost:32769 (1)

# JENKINS_CRUMB is needed if your Jenkins master has CRSF protection enabled (which it should)
JENKINS_CRUMB=`curl "$JENKINS_URL/crumbIssuer/api/xml?xpath=concat(//crumbRequestField,\":\",//crumb)"`
curl -X POST -H $JENKINS_CRUMB -F "jenkinsfile=<Jenkinsfile" $JENKINS_URL/pipeline-model-converter/validate
1This is not secure. I’m running this locally only. See Jenkins CLI for details on how to do this securely.

With this script, I was able to find the error in this this Pipeline without having to take the time to run it in Jenkins: (Can you spot the mistake?)

1
2
3
4
5
6
7
8
9
10
11
12
13
14
15
16
17
18
19
20
21
22
23
24
25
26
27
28
29
30
31
32
33
34
35
36
37
38
39
40
41
42
43
44
45
46
47
48
49
50
51
52
53
54
55
56
#!groovy

pipeline {
  agent any
  }
  options {
    // Only keep the 10 most recent builds
    buildDiscarder(logRotator(numToKeepStr:'10'))
  }
  stages {
    stage ('Install') {
      steps {// install required bundles
        sh 'bundle install'
      }
    }
    stage ('Build') {
      steps {// build
        sh 'bundle exec rake build'
      }

      post {
        success {
          // Archive the built artifacts
          archive includes: 'pkg/*.gem'
        }
      }
    }
    stage ('Test') {
      step {// run tests with coverage
        sh 'bundle exec rake spec'
      }

      post {
        success {
          // publish html
          publishHTML target: [allowMissing: false,alwaysLinkToLastBuild: false,keepAll: true,reportDir: 'coverage',reportFiles: 'index.html',reportName: 'RCov Report'
            ]
        }
      }
    }
  }
  post {
    always {
      echo "Send notifications for result: ${currentBuild.result}"
    }
  }
}

When I ran my pipelint.sh script on this pipeline it reported this error:

$ pipelint.sh
  % Total    % Received % Xferd  Average Speed   Time    Time     Time  Current
                                 Dload  Upload   Total   Spent    Left  Speed
100    46  100    46    0     0   3831      0 --:--:-- --:--:-- --:--:--  4181
Errors encountered validating Jenkinsfile:
WorkflowScript: 30: Unknown stage section "step". Starting with version 0.5, steps in a stage must be in a steps block. @ line 30, column 5.
       stage ('Test') {
       ^

WorkflowScript: 30: Nothing to execute within stage "Test" @ line 34, column 5.
       stage ('Test') {
       ^

Doh. I forgot the "s" on steps on line 35. Once I added the "s" and ranpipelint.sh again, I got an all clear.

$ pipelint.sh
  % Total    % Received % Xferd  Average Speed   Time    Time     Time  Current
                                 Dload  Upload   Total   Spent    Left  Speed
100    46  100    46    0     0   5610      0 --:--:-- --:--:-- --:--:--  5750
Jenkinsfile successfully validated.

This didn’t mean there weren’t other errors, but for a two second smoke test I’ll take it.

Replay

I love being able to use source control to track changes to my Pipelines right alongside the rest of the code in a project. There are also times, when prototyping or debugging, that I need to iterate quickly on a series of possible Pipeline changes. The Replay feature let’s me do that and see the results, without committing those changes to source control.

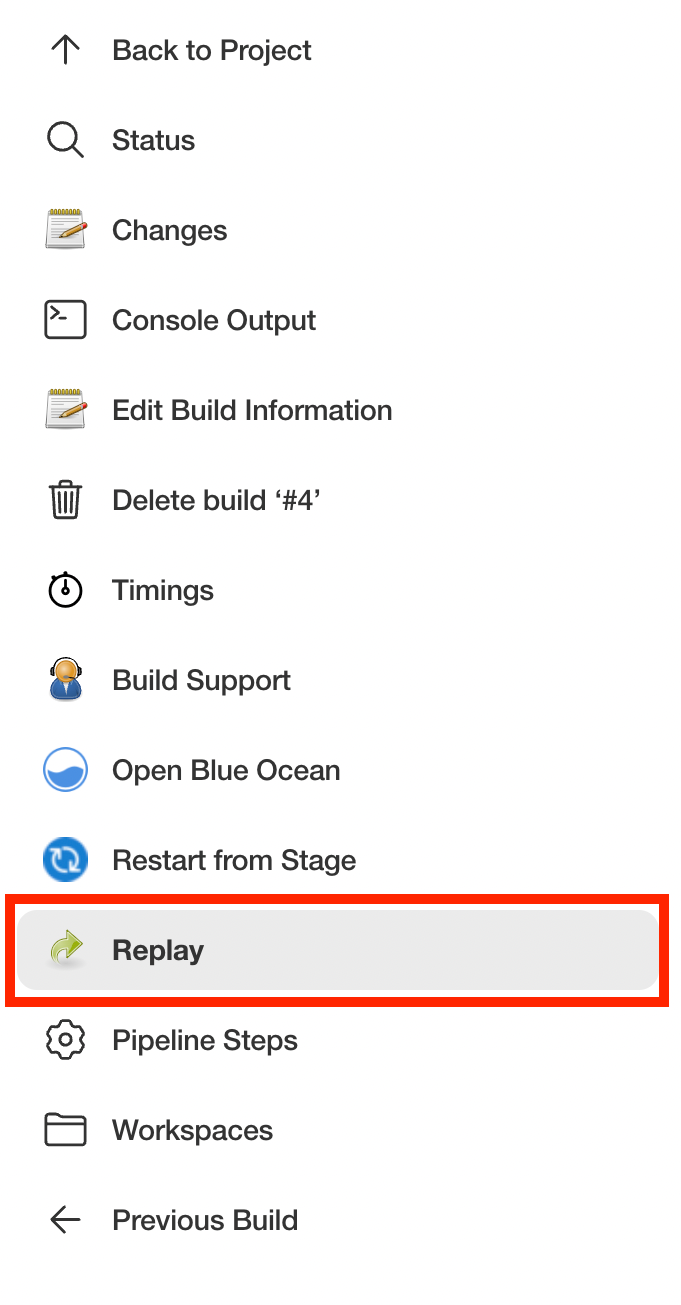
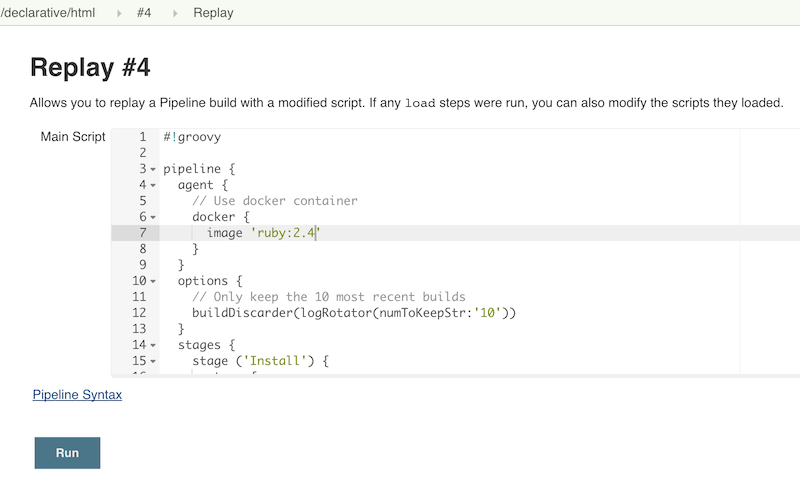
When I wanted to take the previous Pipeline from agent any to using Docker via the docker { ... } directive, I used the Replay feature to test it out:

  1. Selected the previously completed run in the build history

    Previous Pipeline Run
  2. Clicked "Replay" in the left menu

    Replay Left-menu Button
  3. Made modifications and click "Run". In this example, I replaced any with the docker { ... } directive.

    Replay Left-menu Button
  4. Checked the results of changes looked good.

Once I worked any bugs out of my Pipeline, I used Replay to view the Pipeline for the last run and copy it back to myJenkinsfile and create a commit for that change.

Conclusion

This is far from a complete list of the tools out there for working with Pipeline. There are many more and the number is growing. For example, one tool I just recently heard about and haven’t had a chance to delve into is the Pipeline Unit Testing Framework, which promises the ability to test Pipelines before running them. It’s been a fun year and I can’t wait to see what the next year holds for Pipeline.

How do you work with Pipeline? Do you have a tool that you feel has greatly improved your development experience with Pipeline? I’m interested in hear about others Jenkins user’s favorite ways of working with Pipeline. Drop me a line via email or on the#jenkins IRC channel.

Blue Ocean 1.1 - fast search for pipelines and much more

$
0
0

The Blue Ocean team are proud to announce the release of Blue Ocean 1.1. We’ve shipped a tonne of small improvements, features and bug fixes here that will make your day-to-day experience with Blue Ocean even smoother.

Today is also the first time we are promoting our Public Roadmap. We recognise that using JIRA can be a bit of a pain to track what we are working on at a macro level and the Public Roadmap makes it very easy for anyone to find out what we are working on. We’ve got some really cool stuff coming, so check back here soon!

It’s been an insane two months since the launch of Blue Ocean 1.0 and there are now officially over 10,000 teams using Blue Ocean – so here’s a big “thank you” to all of you for your support.

Now, lets get to the goods!

For those of you who have many pipelines we’ve introduced pipeline fast search to the pipeline dashboard. Click the search icon to activate and just start typing what you’re looking for.

Fast search

Trigger reasons

Differentiate at a glance between pipeline runs that have been manually triggered and by who, triggered automatically by a commit or triggered by any other means.

Trigger Reasons

Blockage reasons

Pipelines can be blocked from execution for a variety of reasons, including waiting for executors or other resources to become free. You can see from the Pipeline Activity, Branch and Result screen why the pipeline is blocked from execution.

Blockage reason

History jump

Developers can quickly jump from the branches tab to the run history for a specific branch. This makes it more convenient to see historical runs for the branch within the Pipeline which improves the your ability to trace down problems.

History jump

Analyse 1,000s of tests

Now you can see more than 100 test results for a Pipeline run. This makes Blue Ocean practical for teams who have invested heavily in testing. We’ve also dramatically improved loading times for Pipelines with large numbers of tests so theres no more waiting for the test tab to load.

Custom run names and descriptions

Developers authoring Pipeline using the scripted syntax can set a custom name and description for Pipeline run. This feature is commonly used to name or describe a pipeline run that is meaningful in their release management workflow.

For example, a developer can set the run name to the release version1.1 and the description to something meaningful, like Final Release.

currentBuild.name = '1.1'
currentBuild.description = ‘Final Release’

Performance

We’ve been making optimisations for general page speed. In Blue Ocean 1.1, plugin data was automatically sent to browser and we’ve made a change so that this data is only sent on the request of plugins. The long and short of it is that you shouldn’t notice a thing except those Blue Ocean pages zipping faster into your browser.

48+ bug fixes

There have been a total of 48 bug improvements, with emphasis on how executing pipelines behave, and we’ve invested a large amount of time to improve automated test coverage of Blue Ocean to ensure reliability in production settings.

For a full list of bug fixes and improvements, see the JIRA.

What are you waiting for? Try Blue Ocean 1.1 today

Jenkins World 2017 Community Awards - Last Call for Nominations!

$
0
0
This is a guest post by Alyssa Tong, who runs the Jenkins Area Meetup program and is also responsible for Marketing & Community Programs at CloudBees, Inc.

We have received a good number of nominations for the Jenkins World 2017 Community Awards. These nominations are indicative of the excellent work Jenkins members are doing for the betterment of Jenkins.

The deadline for nomination is this Friday, June 16.

This will be the first year we are commemorating community members who have shown excellence through commitment, creative thinking, and contributions to continue making Jenkins a great open source automation server. The award categories includes:

  • Most Valuable Contributor - This award is presented to the Jenkins contributor who has helped move the Jenkins project forward the most through their invaluable feature contributions, bug fixes or plugin development efforts.

  • Jenkins Security MVP - This award is presented to the individual most consistently providing excellent security reports or who helped secure Jenkins by fixing security issues.

  • Most Valuable Advocate - This award is presented to an individual who has helped advocate for Jenkins through organization of their local Jenkins Area Meetup.

Submit your story, or nominate someone today! Winners will be announced at Jenkins World 2017 in San Francisco on August 28-31.

We look forward to hearing about the great Jenkins work you are doing.

Come Share the Jenkins World Keynote Stage with Me!

$
0
0

Jenkins World is approaching fast, and the event staff are all busy preparing. I’ve decided to do something different this year as part of my keynote: I want to invite a few Jenkins users like you come up on stage with me.

There have been amazing developments in Jenkins over the past year. For my keynote, I want highlight how the new Jenkins (Pipeline as code with the Jenkinsfile, no more creating jobs,Blue Ocean) is different and better than the old Jenkins (freestyle jobs, chaining jobs together, etc.). All these developments have helped Jenkins users, and it would be more meaningful to have fellow users, like you, share their stories about how recent Jenkins improvements like Pipeline and Blue Ocean have positively impacted them.

If you’re interested sharing your story, please complete this form so that I can contact you. This is a great opportunity to let the rest of the world (and your boss!) hear about your accomplishments. You’ll also get into Jenkins World for free and get to join me backstage. If you concerns about traveling to Jenkins World, I’m happy to discuss helping with that as well.

I look forward to hearing from you.

Extending your Pipeline with Shared Libraries, Global Functions and External Code

$
0
0
This is a guest post by Brent Laster, Senior Manager, Research and Development atSAS.

Jenkins Pipeline has fundamentally changed how users can orchestrate their pipelines and workflows. Essentially, anything that you can do in a script or program can now be done in a Jenkinsfile or in a pipeline script created within the application. But just because you can do nearly anything directly in those mechanisms doesn’t mean you necessarily should.

In some cases, it’s better to abstract the functionality out separately from your main Pipeline. Previously, the main way to do this in Jenkins itself was through creating plugins. With Jenkins 2 and the tight incorporation of Pipeline, we now have another approach – shared libraries.

Brent will bepresenting more of this topic at Jenkins World in August, register with the code JWFOSS for a 20% discount off your pass.

Shared libraries provide solutions for a number of situations that can be challenging or time-consuming to deal with in Pipeline. Among them:

  • Providing common routines that can be accessed across a number of pipelines or within a designated scope (more on scope later)

  • Abstracting out complex or restricted code

  • Providing a means to execute scripted code from calls in declarative pipelines (where scripted code is not normally allowed)

  • Simplifying calls in a script to custom code that only differ by calling parameters

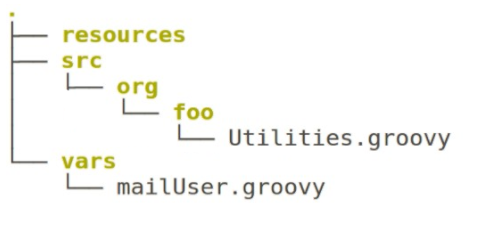
To understand how to use shared libraries in Pipeline, we first need to understand how they are constructed. A shared library for Jenkins consists of a source code repository with a structure like the one below:

jw speaker blog sas 1

Each of the top-level directories has its own purpose.

The resources directory can have non-groovy resources that get loaded via the libraryResource step. Think of this as a place to store supporting data files such as json files.

The src directory uses a structure similar to the standard Java src layout. This area is added to the classpath when a Pipeline that includes this shared library is executed.

The vars directory holds global variables that should be accessible from pipeline scripts. A corresponding .txt file can be included that defines documentation for objects here. If found, this will be pulled in as part of the documentation in the Jenkins application.

Although you might think that it would always be best to define library functions in the src structure, it actually works better in many cases to define them in the vars area. The notion of a global variable may not correspond very well to a global function, but you can think of it as the function being a global value that can be pulled in and used in your pipeline. In fact, to work in a declarative style pipeline, having your function in the vars area is the only option.

Let’s look at a simple function that we can create for a shared library. In this case, we’ll just wrap picking up the location of the Gradle installation from Jenkins and calling the corresponding executable with whatever tasks are passed in as arguments. The code is below:

/vars/gbuild.groovy
defcall(args) {
      sh "${tool 'gradle3'}/bin/gradle ${args}"
}

Notice that we are using a structured form here with the def call syntax. This allows us to simply invoke the routine in our pipeline (assuming we have loaded the shared library) based on the name of the file in the vars area. For example, since we named this file gbuild.groovy, then we can invoke it in our pipeline via a step like this:

gbuild 'clean compileJava'

So, how do we get our shared library loaded to use in our pipeline? The shared library itself is just code in the structure outlined above committed/pushed into a source code repository that Jenkins can access. In our example, we’ll assume we’ve staged, committed, and pushed this code into a local Git repository on the system at /opt/git/shared-library.git.

Like most other things in Jenkins, we need to first tell Jenkins where this shared library can be found and how to reference it "globally" so that pipelines can reference it specifically.

First, though, we need to decide at what scope you want this shared library to be available. The most common case is making it a "global shared library" so that all Pipelines can access it. However, we also have the option of only making shared libraries available for projects in a particular Jenkins Folder structure, or those in a Multibranch Pipeline, or those in a GitHub Organization pipeline project.

To keep it simple, we’ll just define ours to be globally available to all pipelines. Doing this is a two-step process. We first tell Jenkins what we want to call the library and define some default behavior for Jenkins related to the library, such as whether we wanted it loaded implicitly for all pipelines. This is done in the Global Pipeline Libraries section of the Configure System page.

jw speaker blog sas 2

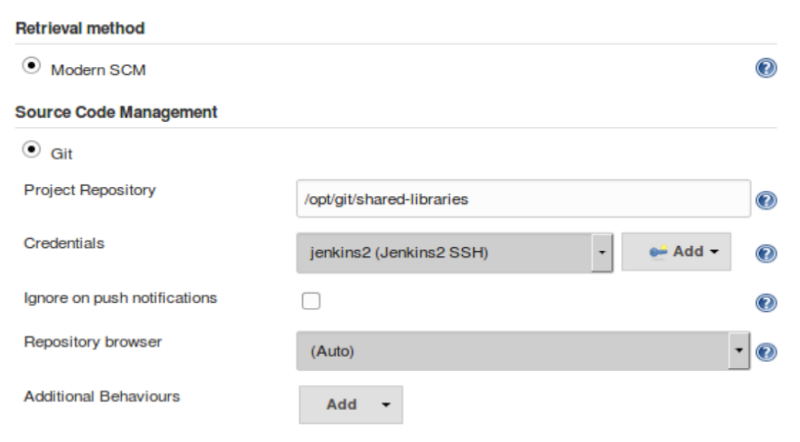
For the second part, we need to tell Jenkins where the actual source repository for the shared library is located. SCM plugins that have been modified to understand how to work with shared libraries are called "Modern SCM". The git plugin in one of these updated plugin, so we just supply the information in the same Configure System page.

jw speaker blog sas 3

After configuring Jenkins so that it can find the shared library repository, we can load the shared library into our pipeline using the @Library('<library name>') annotation. Since Annotations are designed to annotate something that follows them, we need to either include a specific import statement, or, if we want to include everything, we can use an underscore character as a placeholder. So our basic step to load the library in a pipeline would be:

@Library('Utilities2') _

Based on this step, when Jenkins runs our Pipeline, it will first go out to the repository that holds the shared library and clone down a copy to use. The log output during this part of the pipeline execution would look something like this:

Loading library Utilities2@master> git rev-parse --is-inside-work-tree # timeout=10
Setting origin to /opt/git/shared-libraries> git config remote.origin.url /opt/git/shared-libraries # timeout=10
Fetching origin...
Fetching upstream changes from origin> git --version # timeout=10
using GIT_SSH to set credentials Jenkins2 SSH> git fetch --tags --progress origin +refs/heads/*:refs/remotes/origin/*> git rev-parse master^{commit} # timeout=10> git rev-parse origin/master^{commit} # timeout=10
Cloning the remote Git repository
Cloning repository /opt/git/shared-libraries

Then Pipeline can call our shared library gbuild function and translate it to the desired Gradle build commands.

First time build.
Skipping changelog.
[Pipeline] }
[Pipeline] // stage
[Pipeline] stage
[Pipeline] { (Compile)
[Pipeline] tool
[Pipeline] sh
[gsummit17_lab2-4T357CUTJORMC2TIF7WW5LMRR37F7PM2QRUHXUNSRTWTTRHB3XGA]
Running shell script
+ /usr/share/gradle/bin/gradle clean compileJava -x test
Starting a Gradle Daemon (subsequent builds will be faster)

This is a very basic illustration of how using shared libraries work. There is much more detail and functionality surrounding shared libraries, and extending your pipeline in general, than we can cover here.

Be sure to catch my talk onExtending your Pipeline with Shared Libraries, Global Functions and External Code at Jenkins World 2017. Also, watch for my new book onJenkins 2 Up and Running which will have a dedicated chapter on this – expected to be available later this year from O’Reilly.


Jenkins World Contributor Summit

$
0
0

As in previous years, there’ll be a contributor summit at Jenkins World 2017:

Let’s talk about the future of Jenkins and how you can help shape it! The contributor summit is the place where the current and future contributors of the Jenkins project get together. This year, the theme is “working together”. Traditionally, most contributors are plugin maintainers focusing on their own plugins, but it’s important to look at Jenkins as a whole, because that’s how users experience it. There is more to the project beyond writing plugins, and even for plugin developers, there are increasing number of common libraries and modules that plugins should rely on. In short, we should work better together.

A few contributors will prepare some presentations to help clarify what that means, and what all of us can do. And in the afternoon, there will be "unconference" sessions to brainstorm and discuss what we can do and how.

Whether you are already a contributor or just thinking about becoming one, please join us for this full day free event.

Details about this year’s agenda are available on the event’s meetup page. Attending is free, and no Jenkins World ticket is needed, but RSVP if you’re going to attend to help us plan.

See you there!

Delivery pipelines, with Jenkins 2: how to promote Java EE and Docker binaries toward production.

$
0
0

This is a guest post by Michael Hüttermann. Michael is an expert in Continuous Delivery, DevOps and SCM/ALM. More information about him at huettermann.net, or follow him on Twitter: @huettermann.

In a past blog post Delivery Pipelines, we talked about pipelines which result in binaries for development versions. Now, in this blog post, I zoom in to different parts of the holistic pipeline and cover the handling of possible downstream steps once you have the binaries of development versions, in our example a Java EE WAR and a Docker image (which contains the WAR). We discuss basic concept of staging software, including further information about quality gates, and show example toolchains. This contribution particularly examines the staging from binaries from dev versions to release candidate versions and from release candidate versions to final releases from the perspective of the automation server Jenkins, integrating with the binary repository manager JFrog Artifactory and the distribution management platform JFrog Bintray, and ecosystem.

Staging software

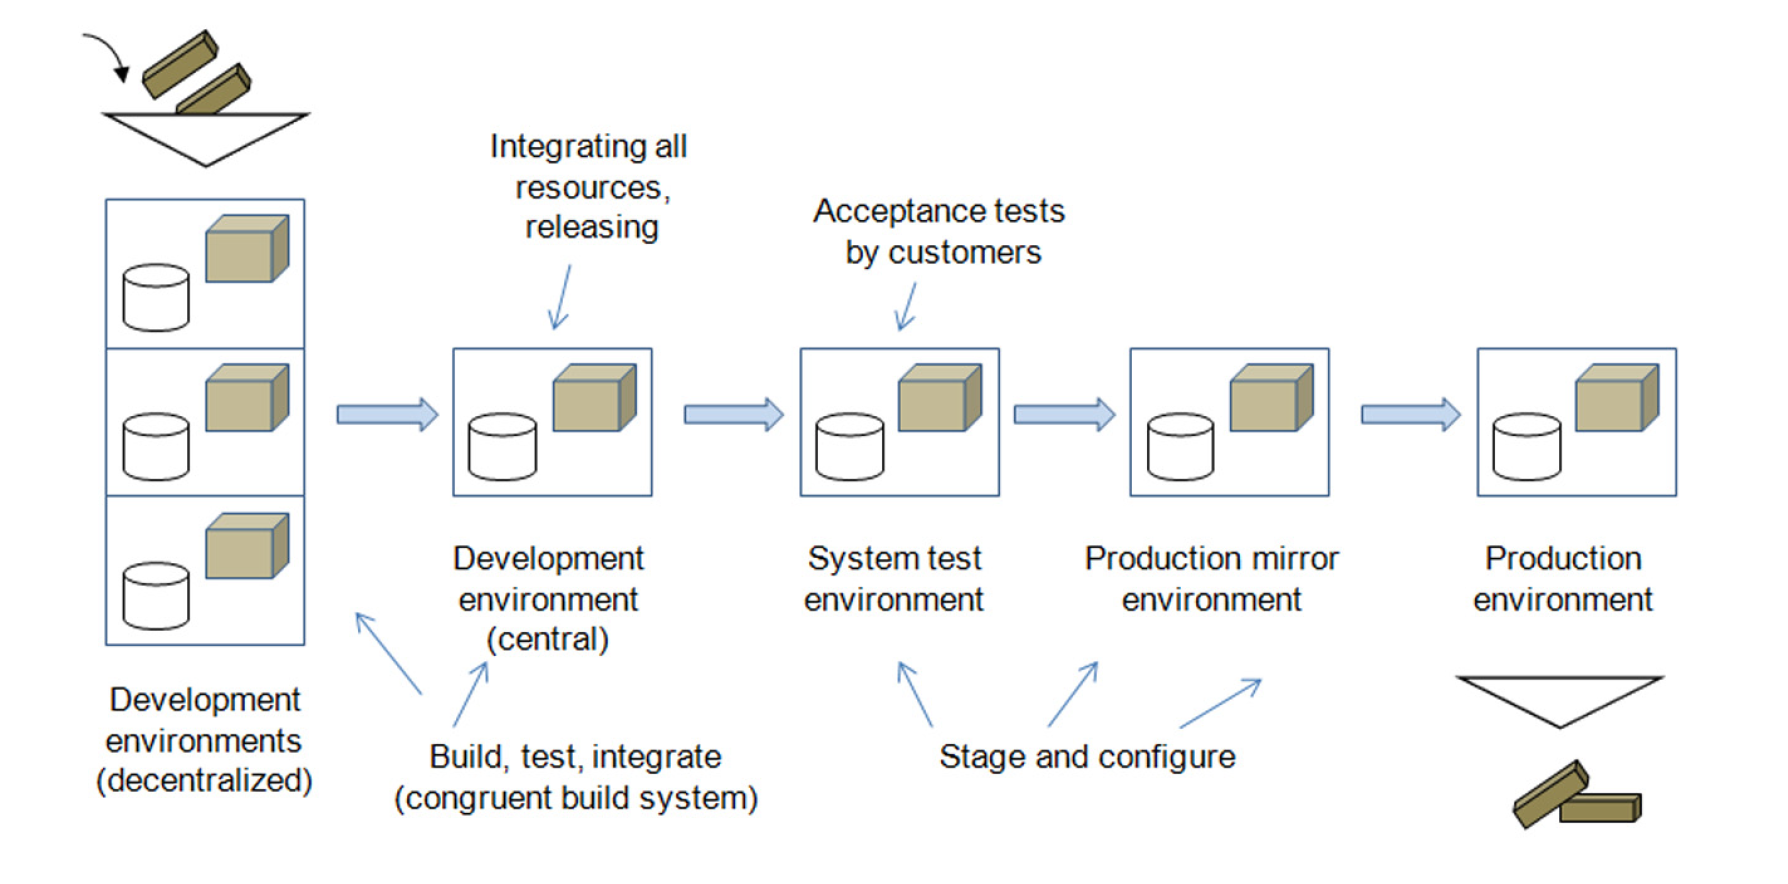
Staging (also often called promoting) software is the process of completely and consistently transferring a release with all its configuration items from one environment to another. This is even more true with DevOps, where you want to accelerate the cycle time (see Michael Hüttermann, DevOps for Developers (Apress, 2012), 38ff). For accelerating the cycle time, meaning to bring software to production, fast and in good quality, it is crucial to have fine processes and integrated tools to streamline the delivery of software. The process of staging releases consists of deploying software to different staging levels, especially different test environments. Staging also involves configuring the software for various environments without needing to recompile or rebuild the software. Staging is necessary to transport the software to production systems in high quality. Many Agile projects make great experience with implementing a staging ladder in order to optimize the cycle time between development software and the point when the end user is able to use the software in production.

01

Commonly, the staging ladder is illustrated on its side, with the higher rungs being the boxes further to the right. It’s good practice not to skip any rungs during staging. The central development environment packages and integrates all respective configuration items and is the base for releasing. Software is staged over different environments by configuration, without rebuilding. All changes go through the entire staging process, although defined exception routines may be in place, for details see Michael Hüttermann, Agile ALM (Manning, 2012).

To make concepts clearer, this blog post covers sample tools. Please note, that there are also alternative tools available. As one example: Sonatype Nexus is also able to host the covered binaries and also offers scripting functionality.

We nowadays often talk about delivery pipelines. A pipeline is just a set of stages and transition rules between those stages. From a DevOps perspective, a pipeline bridges multiple functions in organizations, above all development and operations. A pipeline is a staging ladder. A change enters the pipeline at the beginning and leaves it at the end. The processing can be triggered automatically (typical for delivery pipelines) or by a human actor (typical for special steps at overall pipelines, e.g. pulling and thus cherry-picking specific versions to promote them to be release candidates are final releases).

Pipelines often look different, because they strongly depend on requirements and basic conditions, and can contain further sub pipelines. In our scenario, we have two sub pipelines to manage the promotion of continuous dev versions to release candidates and the promotion of release candidates to final release. A change typically waits at a stage for further processing according to the transition rules, aligned with defined requirements to meet, which are the Quality Gates, explored next.

Quality Gates

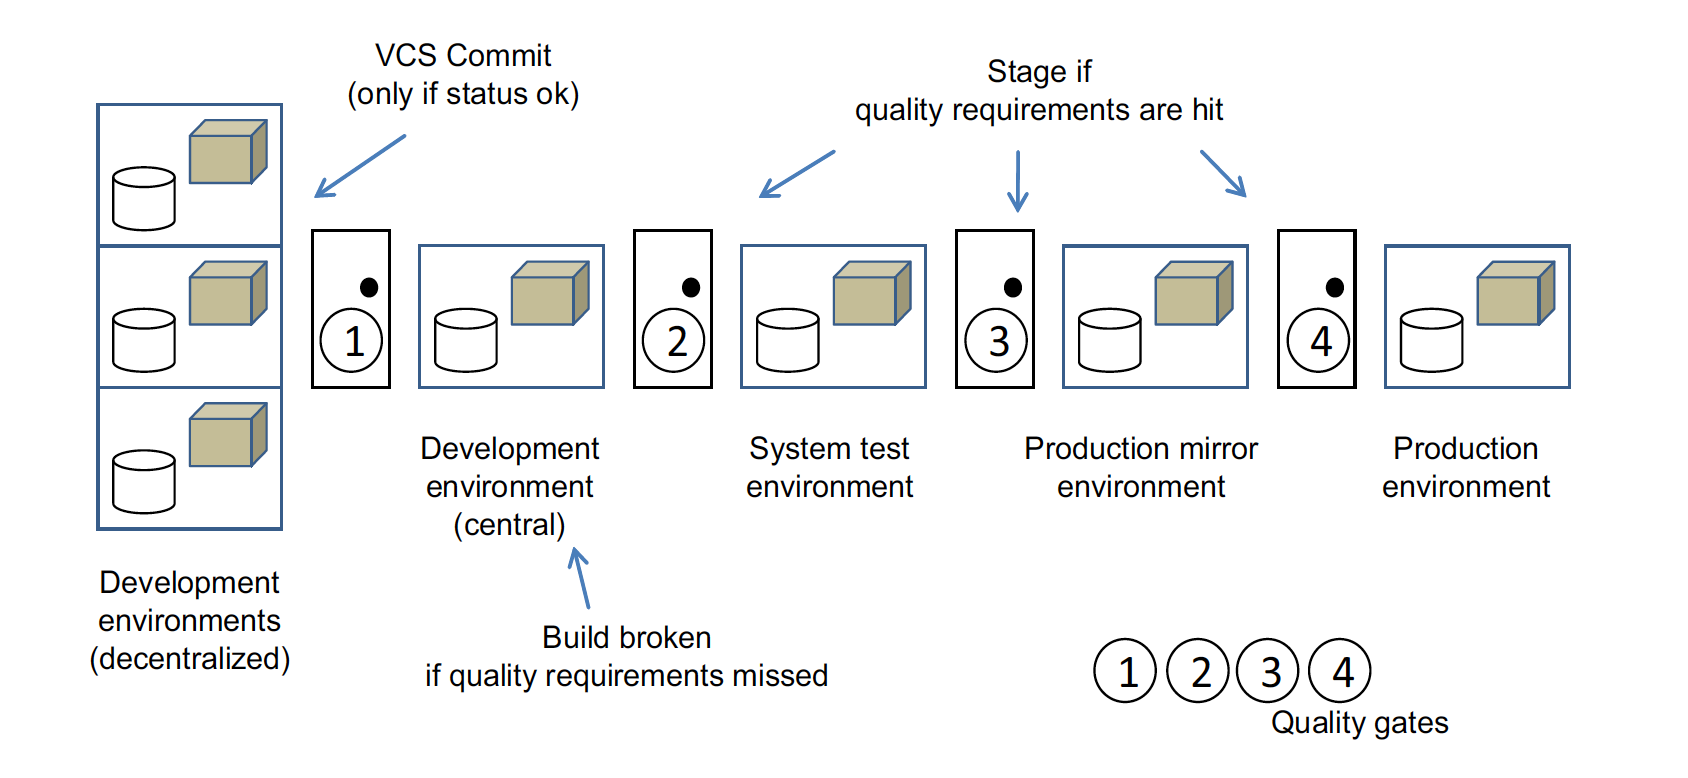
Quality gates allow the software to pass through stages only if it meets their defined requirements. The next illustration shows a staging ladder with quality gates injected. You and other engaged developers commit code to the version control system (please, use VCS as an abbreviation, not SCM, because the latter is much more) in order to update the central test environment only if the code satisfies the defined quality requirements; for instance, the local build may need to run successfully and have all tests pass locally. Build, test, and metrics should pass out of the central development environment, and then automated and manual acceptance tests are needed to pass the system test. In our case, the last quality gate to pass is the one from the production mirror to production. Here, for example, specific production tests are done or relevant documents must be filled in and signed.

02

It’s mandatory to define the quality requirements in advance and to resist customizing them after the fact, when the software has failed. Quality gates are different at lower and higher stages; the latter normally consist of a more severe or broader set of quality requirements, and they often include the requirements of the lower gates. The binary respository manager must underpin corresponding quality gates, while managing the binaries, what we cover next.

This blog post illustrates typical concepts and sample toolchains. For more information, please consult the respective documentation, good books or attend top notch conferences, e.g.Jenkins World, powered by CloudBees.

Binary repository manager

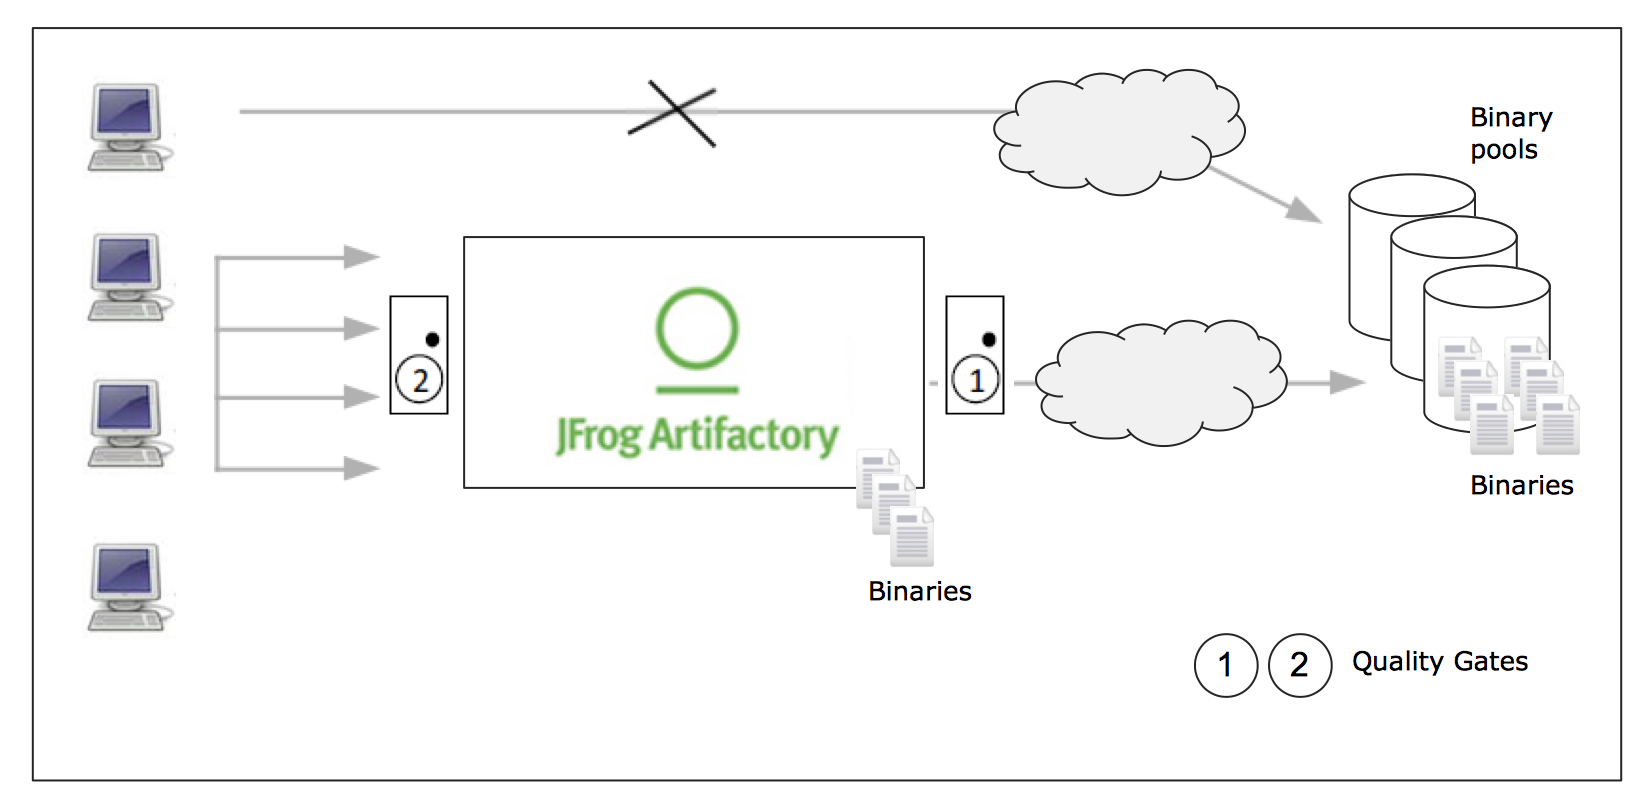
A central backbone of the staging ladder is the binary repository manager, e.g. JFrog Artifactory. The binary repository manager manages all binaries including the self-produced ones (producing view) and the 3rd party ones (consuming view), across all artifact types, in our case a Java EE WAR file and a Docker image. Basic idea here is that the repo manager serves as a proxy, thus all developers access the repo manager, and not remote binary pools directly, e.g. Maven Central. The binary repository manager offers cross-cutting services, e.g. role-based access control on specific logical repositories, which may correspond to specific stages of the staging ladder.

03

Logical repositories can be generic ones (meaning they are agnostic regarding any tools and platforms, thus you can also just upload the menu of your local canteen) or repos specific to tools and platforms. In our case, we need a repository for managing the Java EE WAR files and for the Docker images. This can be achieved by

  • a generic repository (prefered for higher stages) or a repo which is aligned with the layout of the Maven build tool, and

  • a repository for managing Docker images, which serves as a Docker registry.

In our scenario, preparing the staging of artifacts includes the following ramp-up activities

  1. Creating two sets of logical repositories, inside JFrog Artifactory, where each set has a repo for the WAR file and a repo for the Docker image, and one set is for managing dev versions and one set is for release candidate versions.

  2. Defining and implementing processes to promote the binaries from the one set of repositories (which is for dev versions) to the other set of repositories (which is for RC versions). Part of the process is defining roles, and JFrog Artifactory helps you to implement role-based access control.

  3. Setting up procedures or scripts to bring binaries from one set of repositories to the other set of repositories, reproducibly. Adding meta data to binaries is important if the degree of maturity of the binary cannot be easily derived from the context.

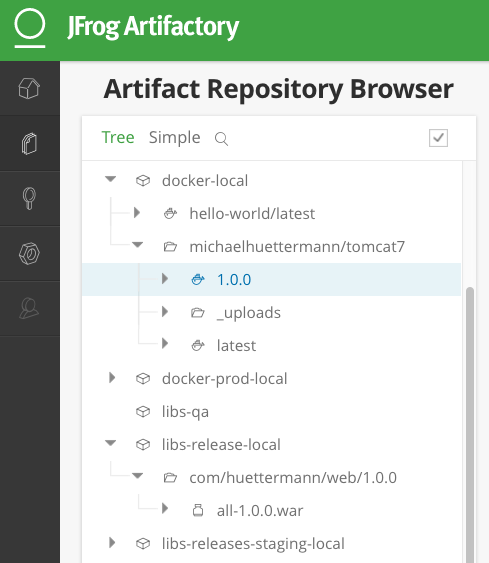
The following illustration shows a JFrog Artifactory instance with the involved logical repos in place. In our simplified example, the repo promotions are supposed to go fromdocker-local to docker-prod-local, and from libs-release-local to libs-releases-staging-local. In our use case, we promote the software in version 1.0.0.

04

Another type of binary repository manager is JFrog Bintray, which serves as a universal distribution platform for many technologies. JFrog Bintray can be an interesting choice if you have strong requirements for scalability and worldwide coverage including IP restrictions and handy features around statistics. Most of the concepts and ramp up activities are similar compared to JFrog Artifactory, thus I do not want to repeat them here. Bintray is used by lot of projects e.g. by Groovy, to host their deliverables in the public. But keep in mind that you can of course also host your release binaries in JFrog Artifactory. In this blog post, I’d like to introduce different options, thus we promote our release candidates to JFrog Artifactory and our releases to JFrog Bintray. Bintray has the concept of products, packages and versions. A product can have multiple packages and has different versions. In our example, the product has two packages, namely the Java EE WAR and the Docker image, and the concrete version that will be processed is 1.0.0.

Some tool features covered in this blog post are avaialable as part of commercial offerings of tool vendors. Examples include the Docker support of JFrog Artifactory or the Firehose Event API of JFrog Bintray. Please consult the respective documentation for more information.

Now it is time to have a deeper look at the pipelines.

Implementing Pipelines

Our example pipelines are implemented with Jenkins, including its Blue Ocean and declarative pipelines facilities, JFrog Artifactory and JFrog Bintray. To derive your personal pipelines, please check your individual requirements and basic conditions to come up with the best solution for your target architecture, and consult the respective documentation for more information, e.g. about scripting the tools.

In case your development versions are built with Maven, and have SNAPSHOT character, you need to either rebuild the software after setting the release version, as part of your pipeline, or you solely use Maven releases from the very beginning. Many projects make great experience with morphing Maven snapshot versions into release versions, as part of the pipeline, by using a dedicated Maven plugin, and externalizing it into a Jenkins shared library. This can look like the following:

sl.groovy (excerpt): A Jenkins shared library, to include in Jenkins pipelines.
    #!/usr/bin/groovy
    def call(args) { (1)
       echo "Calling shared library, with ${args}."
       sh "mvn com.huettermann:versionfetcher:1.0.0:release versions:set -DgenerateBackupPoms=false -f ${args}"  (2)
    }
1We provide a global variable/function to include it in our pipelines.
2The library calls a Maven plugin, which dynamically morphs the snapshot version of a Maven project to a release version.

And including it into the pipeline is then also very straight forward:

pipeline.groovy (excerpt): A stage calling a Jenkins shared library.
    stage('Produce RC') { (1)
        releaseVersion 'all/pom.xml' (2)
    }
1This stage is part of a scripted pipeline and is dedicated to morphing a Maven snapshot version into a release version, dynamically.
2We call the Jenkins shared library, with a parameter pointing to the Maven POM file, which can be a parent POM.

You can find the code of the underlying Maven plugin here.

Let’s now discuss how to proceed for the release candidates.

Release Candidate (RC)

The pipeline to promote a dev version to a RC version does contain a couple of different stages, including stages to certify the binaries (meaning labeling it or adding context information) and stages to process the concrete promotion. The following illustration shows the successful run of the promotion, for software version 1.0.0.

05

We utilize Jenkins Blue Ocean that is a new user experience for Jenkins based on a personalizable, modern design that allows users to graphically create, visualize and diagnose delivery pipelines. Besides the new approach in general, single Blue Ocean features help to boost productivity dramatically, e.g. to provide log information at your fingertips and the ability to search pipelines. The stages to perform the promote are as follows starting with the Jenkins pipeline stage for promoting the WAR file. Keep in mind that all scripts are parameterized, including variables for versions and Artifactory domain names, which are either injected to the pipeline run by user input or set system wide in the Jenkins admin panel, and the underlying call is using the JFrog command line interface, CLI in short. JFrog Artifactory as well as JFrog Bintray can be used and managed by scripts, based on a REST API. The JFrog CLI is an abstraction on top of the JFrog REST API, and we show sample usages of both.

pipeline.groovy (excerpt): Staging WAR file to different logical repository
    stage('Promote WAR') { (1)
       steps { (2)
          sh 'jfrog rt cp --url=https://$ARTI3 --apikey=$artifactory_key --flat=true libs-release-local/com/huettermann/web/$version/ ' + (3)
             'libs-releases-staging-local/com/huettermann/web/$version/'
       }
    }
1The dedicated stage for running the promotion of the WAR file.
2Here we have the steps which make up the stage, based on Jenkins declarative pipeline syntax.
3Copying the WAR file, with JFrog CLI, using variables, e.g. the domain name of the Artifactory installation. Many options available, check the docs.

The second stage to explore more is the promotion of the Docker image. Here, I want to show you a different way how to achieve the goal, thus in this use case we utilize the JFrog REST API.

pipeline.grovvy (excerpt): Promote Docker image
    stage('Promote Docker Image') {
          sh '''curl -H "X-JFrog-Art-Api:$artifactory_key" -X POST https://$ARTI3/api/docker/docker-local/v2/promote ''' + (1)
             '''-H "Content-Type:application/json" ''' + (2)
             '''-d \'{"targetRepo" : "docker-prod-local", "dockerRepository" : "michaelhuettermann/tomcat7", "tag": "\'$version\'", "copy": true }\' (3)
             '''
    }
1The shell script to perform the staging of Docker image is based on JFrog REST API.
2Part of parameters are sent in JSON format.
3The payload tells the REST API endpoint what to to, i.e. gives information about target repo and tag.

Once the binaries are promoted (and hopefully deployed and tested on respective environments before), we can promote them to become final releases, which I like to call GA.

General Availability (GA)

In our scenario, JFrog Bintray serves as the distribution platform to manage and provide binaries for further usage. Bintray can also serve as a Docker registry, or can just provide binaries for scripted or manual download. There are again different ways how to promote binaries, in this case from the RC repos inside JFrog Artifactory to the GA storage in JFrog Bintray, and I summarize one of those possible ways. First, let’s look at the Jenkins pipeline, showed in the next illustration. The processing is on its way, currently, and we again have a list of linked stages.

06

Zooming in now to the key stages, we see that promoting the WAR file is a set of steps that utilize JFrog REST API. We download the binary from JFrog Artifactory, parameterized, and upload it to JFrog Bintray.

pipeline.groovy (excerpt): Promote WAR to Bintray
    stage('Promote WAR to Bintray') {
       steps {
          sh '''
             curl -u michaelhuettermann:${bintray_key} -X DELETE https://api.bintray.com/packages/huettermann/meow/cat/versions/$version (1)
             curl -u michaelhuettermann:${bintray_key} -H "Content-Type: application/json" -X POST https://api.bintray.com/packages/huettermann/meow/cat/$version --data """{ "name": "$version", "desc": "desc" }""" (2)
             curl -T "$WORKSPACE/all-$version-GA.war" -u michaelhuettermann:${bintray_key} -H "X-Bintray-Package:cat" -H "X-Bintray-Version:$version" https://api.bintray.com/content/huettermann/meow/ (3)
             curl -u michaelhuettermann:${bintray_key} -H "Content-Type: application/json" -X POST https://api.bintray.com/content/huettermann/meow/cat/$version/publish --data '{ "discard": "false" }' (4)
          '''
       }
    }
1For testing and demo purposes, we remove the existing release version.
2Next we create the version in Bintray, in our case the created version is 1.0.0. The value was insert by user while triggering the pipeline.
3The upload of the WAR file.
4Bintray needs a dedicated publish step to make the binary publicy available.

Processing the Docker image is as easy as processing the WAR. In this case, we just push the Docker image to the Docker registry, which is served by JFrog Bintray.

pipeline.groovy (excerpt): Promote Docker image to Bintray
    stage('Promote Docker Image to Bintray') { (1)
       steps {
          sh 'docker push $BINTRAYREGISTRY/michaelhuettermann/tomcat7:$version' (2)
       }
    }
1The stage for promoting the Docker image. Please note, depending on your setup, you may add further stages, e.g. to login to your Docker registry.
2The Docker push of the specific version. Note, that also here all variables are parameterized.

We now have promoted the binaries and uploaded them to JFrog Bintray. The overview page of our product lists two packages: the WAR file and the Docker image. Both can be downloaded now and used, the Docker image can be pulled from the JFrog Bintray Docker registry with native Docker commands.

07

As part of its graphical visualization capabilitites, Bintray is able to show the single layers of the uploaded Docker images.

08

Bintray can also display usage statistics, e.g. download details. Now guess where I’m sitting right now while downloading the binary?

09

Besides providing own statistics, Bintray provides the JFrog Firehose Event API. This API streams live usage data, which in turn can be integrated or aggregated with your ecosystem. In our case, we visualize the data, particularly download, upload, and delete statistics, with the ELK stack, as part of a functional monitoring initiative.

10

Crisp, isn’t it?

Summary

This closes are quick ride through the world of staging binaries, based on Jenkins. We’ve discussed concepts and example DevOps enabler tools, which can help to implement the concepts. Along the way, we discussed some more options how to integrate with ecosystem, e.g. releasing Maven snapshots and functional monitoring with dedicated tools. After this appetizer you may want to now consider to double-check your staging processes and toolchains, and maybe you find some room for further adjustments.

Continuous Integration for C/C++ Projects with Jenkins and Conan

$
0
0
This is a guest post by Luis Martínez de Bartolomé, Conan Co-Founder

C and C++ are present in very important industries today, including Operating Systems, embedded systems, finances, research, automotive, robotics, gaming, and many more. The main reason for this is performance, which is critical to many of these industries, and cannot be compared to any other technology. As a counterpart, the C/C++ ecosystem has a few important challenges to face:

  • Huge projects - With millions of lines of code, it’s very hard to manage your projects without using modern tools.

  • Application Binary Interface (ABI) incompatibility - To guarantee the compatibility of a library with other libraries and your application, different configurations (such as the operating system, architecture, and compiler) need to be under control.

  • Slow compilation times - Due to header inclusion and pre-processor bloat, together with the challenges mentioned above, it requires special attention to optimize the process and rebuild only the libraries that need to be rebuilt.

  • Code linkage and inlining - A static C/C++ library can embed headers from a dependent library. Also, a shared library can embed a static library. In both cases, you need to manage the rebuild of your library when any of its dependencies change.

  • Varied ecosystem - There are many different compilers and build systems, for different platforms, targets and purposes.

This post will show how to implement DevOps best practices for C/C++ development, using Jenkins CI, Conan C/C++ package manager, and JFrog Artifactory the universal artifact repository.

Conan, The C/C++ Package Manager

Conan was born to mitigate these pains.

Conan uses python recipes, describing how to build a library by explicitly calling any build system, and also describing the needed information for the consumers (include directories, library names etc.). To manage the different configurations and the ABI compatibility, Conan uses "settings" (os, architecture, compiler…). When a setting is changed, Conan generates a different binary version for the same library:

diagram1

The built binaries can be uploaded to JFrog Artifactory or Bintray, to be shared with your team or the whole community. The developers in your team won’t need to rebuild the libraries again, Conan will fetch only the needed Binary packages matching the user’s configuration from the configured remotes (distributed model). But there are still some more challenges to solve:

  • How to manage the development and release process of your C/C++ projects?

  • How to distribute your C/C++ libraries?

  • How to test your C/C++ project?

  • How to generate multiple packages for different configurations? *How to manage the rebuild of the libraries when one of them changes?

Conan Ecosystem

The Conan ecosystem is growing fast, and DevOps with C/C++ is now a reality:

  • JFrog Artifactory manages the full development and releasing cycles.

  • JFrog Bintray is the universal distribution hub.

  • Jenkins automates the project testing, generates different binary configurations of your Conan packages, and automates the rebuilt libraries.

diagram2

Jenkins Artifactory plugin

  • Provides a Conan DSL, a very generic but powerful way to call Conan from a Jenkins Pipeline script.

  • Manages the remote configuration with your Artifactory instance, hiding the authentication details.

  • Collects from any Conan operation (installing/uploading packages) all the involved artifacts to generate and publish the buildInfo to Artifactory. The buildInfo object is very useful, for example, to promote the created Conan packages to a different repository and to have full traceability of the Jenkins build:

JFrogArtifactoryBuildBrowser

Here’s an example of the Conan DSL with the Artifactory plugin. First we configure the Artifactory repository, then retrieve the dependencies and finally build it:

def artifactory_name = "artifactory"
def artifactory_repo = "conan-local"
def repo_url = 'https://github.com/memsharded/example-boost-poco.git'
def repo_branch = 'master'
node {
   def server
   def client
   def serverName
stage("Get project"){
    git branch: repo_branch, url: repo_url
}
stage("Configure Artifactory/Conan"){
    server = Artifactory.server artifactory_name
    client = Artifactory.newConanClient()
    serverName = client.remote.add server: server, repo: artifactory_repo
}
stage("Get dependencies and publish build info"){
    sh "mkdir -p build"
    dir ('build') {
      def b = client.run(command: "install ..")
      server.publishBuildInfo b
    }
}
    stage("Build/Test project"){
        dir ('build') {
          sh "cmake ../ && cmake --build ."
        }
    }
}

You can see in the above example that the Conan DSL is very explicit. It helps a lot with common operations, but also allows powerful and custom integrations. This is very important for C/C++ projects, because every company has a very specific project structure, custom integrations etc.

Complex Jenkins Pipeline operations: Managed and parallelized libraries building

As we saw at the beginning of this blog post, it’s crucial to save time when building a C/C++ project. Here are several ways to optimize the process:

  • Only re-build the libraries that need to be rebuilt. These are the libraries that have been affected by a dependant library that has changed.

  • Build in parallel, if possible. When there is no relation between two or more libraries in the project graph, you can build them in parallel.

  • Build different configurations (os, compiler, etc) in parallel. Use different slaves if needed.

Let’s see an example using Jenkins Pipeline feature

diagram3

The above graph represents our project P and its dependencies (A-G). We want to distribute the project for two different architectures, x86 and x86_64.

What happens if we change library A?

If we bump the version to A(v1) there is no problem, we can update the B requirement and also bump its version to B(v1) and so on. The complete flow would be as follows:

  • Push A(v1) version to Git, Jenkins will build the x86 and x86_64 binaries. Jenkins will upload all the packages to Artifactory.

  • Manually change B to v1, now depending on A1, push to Git, Jenkins will build the B(v1) for x86 and x86_64 using the retrieved new A1 from Artifactory.

  • Repeat the same process for C, D, F, G and finally our project.

But if we are developing our libraries in a development repository, we probably depend on the latest A version or will override A (v0) packages on every git push, and we want to automatically rebuild the affected libraries in this case B, D, F, G and P.

How we can do this with Jenkins Pipelines?

First we need to know which libraries need to be rebuilt. The "conan info --build_order" command identifies the libraries that were changed in our project, and also tells us which can be rebuilt in parallel.

So, we created two Jenkins pipelines tasks:

  • The SimpleBuild task which builds every single library. Similar to the first example using Conan DSL with the Jenkins Artifactory plugin. It’s a parameterized task that receives the libraries that need to built.

  • The MultiBuild task which coordinates and launches the "SimpleBuild" tasks, in parallel when possible.

We also have a repository with a configuration yml. The Jenkins tasks will use it to know where the recipe of each library is, and the different profiles to be used. In this case they are x86 and x86_64.

leaves:
  PROJECT:
    profiles:
       - ./profiles/osx_64
       - ./profiles/osx_32
artifactory:
  name: artifactory
  repo: conan-local
repos:
 LIB_A/1.0:
   url: https://github.com/lasote/skynet_example.git
   branch: master
   dir: ./recipes/A
LIB_B/1.0:
 url: https://github.com/lasote/skynet_example.git
 branch: master
 dir: ./recipes/b
PROJECT:
 url: https://github.com/lasote/skynet_example.git
 branch: master
 dir: ./recipes/PROJECT

If we change and push library A to the repository, the "MultiBuild" task will be triggered. It will start by checking which libraries need to be rebuilt, using the "conan info" command. Conan will return something like this:[B, [D, F], G]

This means that we need to start building B, then we can build D and F in parallel, and finally build G. Note that library C does not need to be rebuilt, because it’s not affected by a change in library A.

The "MultiBuild" Jenkins pipeline script will create closures with the parallelized calls to the "SimpleBuild" task, and finally launch the groups in parallel.

//for each group
      tasks = [:]
      // for each dep in group
         tasks[label] = { -> build(job: "SimpleBuild",
                            parameters: [
                               string(name: "build_label", value: label),
                               string(name: "channel", value: a_build["channel"]),
                               string(name: "name_version", value: a_build["name_version"]),
                               string(name: "conf_repo_url", value: conf_repo_url),
                               string(name: "conf_repo_branch", value: conf_repo_branch),
                               string(name: "profile", value: a_build["profile"])
                            ]
                     )
          }
     parallel(tasks)

Eventually, this is what will happen:

  • Two SimpleBuild tasks will be triggered, both for building library B, one for x86 and another for x86_64 architectures

    diagram4

  • Once "A" and "B" are built, "F" and "D" will be triggered, 4 workers will run the "SimpleBuild" task in parallel, (x86, x86_64)

    diagram5

  • Finally "G" will be built. So 2 workers will run in parallel.

    The Jenkins Stage View for the will looks similar to the figures below:

    MultiBuild

    MultiBuild

    SimpleBuild

    SimpleBuild

We can configure the "SimpleBuild" task within different nodes (Windows, OSX, Linux…), and control the number of executors available in our Jenkins configuration.

Conclusions

Embracing DevOps for C/C++ is still marked as a to-do for many companies. It requires a big investment of time but can save huge amounts of time in the development and releasing life cycle for the long run. Moreover it increases the quality and the reliability of the C/C++ products. Very soon, adoption of DevOps for C/C++ companies will be a must!

The Jenkins example shown above that demonstrating how to control the library building in parallel is just Groovy code and a custom convenient yml file. The great thing about it is not the example or the code itself. The great thing is the possibility of defining your own pipeline scripts to adapt to your specific workflows, thanks to Jenkins Pipeline, Conan and JFrog Artifactory.

More on this topic will be presented at Jenkins Community Day Paris on July 11, and Jenkins User Conference Israel on July 13.

Security updates for multiple Jenkins plugins

$
0
0

Multiple Jenkins plugins received updates today that fix several security vulnerabilities, including high severity ones:

Additionally, the SSH Plugin received a security update a few days ago.

For an overview of what was fixed, see the security advisory.

Subscribe to the jenkinsci-advisories mailing list to receive important notifications related to Jenkins security.

Automated Software Maintenance

$
0
0
This is a guest post by Kevin Burnett, DevOps Lead atRosetta Stone.

Have you experienced that thing where you make a change in an app, and when you go to check on the results of the build, you find an error that really doesn’t seem relevant to your change? And then you notice that your build is the first in over a year. And then you realize that you have accidentally become the subject matter expert in this app.

You have no clue what change caused this failure or when that change occurred. Did one Jenkins agent become asnowflake server, accruing cruft on the file system that is not cleaned up before each build? Did some unpinned external dependency upgrade in a backwards-incompatible fashion? Did the credentials the build plan was using to connect to source control get rotated? Did a dependent system go offline? Or - and I realize that this is unthinkable - did you legitimately break a test?

Not only is this type of archaeological expedition often a bad time for the person who happened to commit to this app ("No good deed goes unpunished"), but it’s also unnecessary. There’s a simple way to reduce the cognitive load it takes to connect cause and effect: build more frequently.

One way we achieve this is by writing scripts to maintain our apps. When we build, the goal is that an equivalent artifact should be produced unless there was a change to the app in source control. As such, we pin all of our dependencies to specific versions. But we also don’t want to languish on old versions of dependencies, whether internal or external. So we also have an auto-maintain script that bumps all of these versions and commit the result.

I’ll give an example. We use docker to build and deploy our apps, and each app depends on a base image that we host in a docker registry. So a Dockerfile in one of our apps would have a line like this:

FROM our.registry.example.com/rosettastone/sweet-repo:jenkins-awesome-project-sweet-repo-5

We build our base images in Jenkins and tag them with the "jenkins" $BUILD_TAG, so this app is using build 5 of the rosettastone/sweet-repo base image. Let’s say we updated our sweet-repo base image to use ubuntu 16.04 instead of 14.04 and this resulted in build 6 of the base image. Our auto-maintain script takes care of upgrading an app that uses this base image to the most recent version. The steps in the auto-maintain script look like this:

  1. Figure out what base image tag you’re using.

  2. Find the newest version of that base image tag by querying the docker registry.

  3. If necessary, update the FROM line in the app’s Dockerfile to pull in the most recent version.

We do the same thing with library dependencies. If our Gemfile.lock is referencing an old library, running auto-maintain will update things. The same applies to our Jenkinsfile`s. If we decide to implement a new policy where we discard old builds, we update `auto-maintain so that it will bring each app into compliance with the policy, by changing, for example, this Jenkinsfile:

Jenkinsfile (Before)
pipeline {
  agent { label 'docker' }
  stages {
    stage('commit_stage') {
      steps {
        sh('./bin/ci')
      }
    }
  }
}

to this:

Jenkinsfile (After)
pipeline {
  agent { label 'docker' }
  options {
    buildDiscarder(logRotator(numToKeepStr: '100'))
  }
  stages {
    stage('commit_stage') {
      steps {
        sh('./bin/ci')
      }
    }
  }
}

We try to account for these sorts of things (everything that we can) in ourauto-maintain script rather than updating apps manually, since this reduces the friction in keeping apps standardized.

Once you create an auto-maintain script (start small), you just have to run it. We run ours based on both "actions" and "non-actions." When an internal library changes, we kick off app builds, so a library’s Jenkinsfile might look like this:

Jenkinsfile
pipeline {
  agent { label 'docker' }
  stages {
    stage('commit_stage') {
      steps {
        sh('./bin/ci')
      }
    }
    stage('auto_maintain_things_that_might_be_using_me') {
      steps {
        build('hot-project/auto-maintain-all-apps/master')
      }
    }
  }
}

When auto-maintain updates something in an app, we have it commit the change back to the app, which in turn triggers a build of that app, and—​if all is well—​a production deployment.

The only missing link then for avoiding one-year build droughts is to get around the problem where auto-commit isn’t actually updating anything in a certain app. If no dependencies are changing, or if the technology in question is not receiving much attention, auto-maintain might not do anything for an extended period of time, even if the script is run on a schedule usingcron. For those cases, putting a cron trigger in the Pipeline for each app will ensure that builds still happen periodically:

Jenkinsfile
pipeline {
  agent { label 'docker' }
  triggers {
    cron('@weekly')
  }
  stages {
    stage('commit_stage') {
      steps {
        sh('./bin/ci')
      }
    }
  }
}

In most cases, these periodic builds won’t do anything different from the last build, but when something does break, this strategy will allow you to decide when you find out about it (by making your cron @weekly, @daily, etc) instead of letting some poor developer find out about it when they do something silly like commit code to an infrequently-modified app.

Kevin will bepresenting more on this topic atJenkins World in August, register with the code JWFOSS for a 30% discount off your pass.

Viewing all 1088 articles
Browse latest View live